

By Dan Zolet, CFA
The Large-Cap vs Small-Cap Debate…Through a Sector Lens
In last week’s Strategic View we explained our preference for large-cap over small-cap equities. This week we are taking a deeper dive into small-caps, comparing four different sectors: Financials, Technology, Healthcare, and Industrials. The findings are consistent with our cautious macro view on small-caps and strengthens our conviction not to invest broadly in them currently.
Financials: Rising Rates and Negative Feedback Loops for Regional Banks
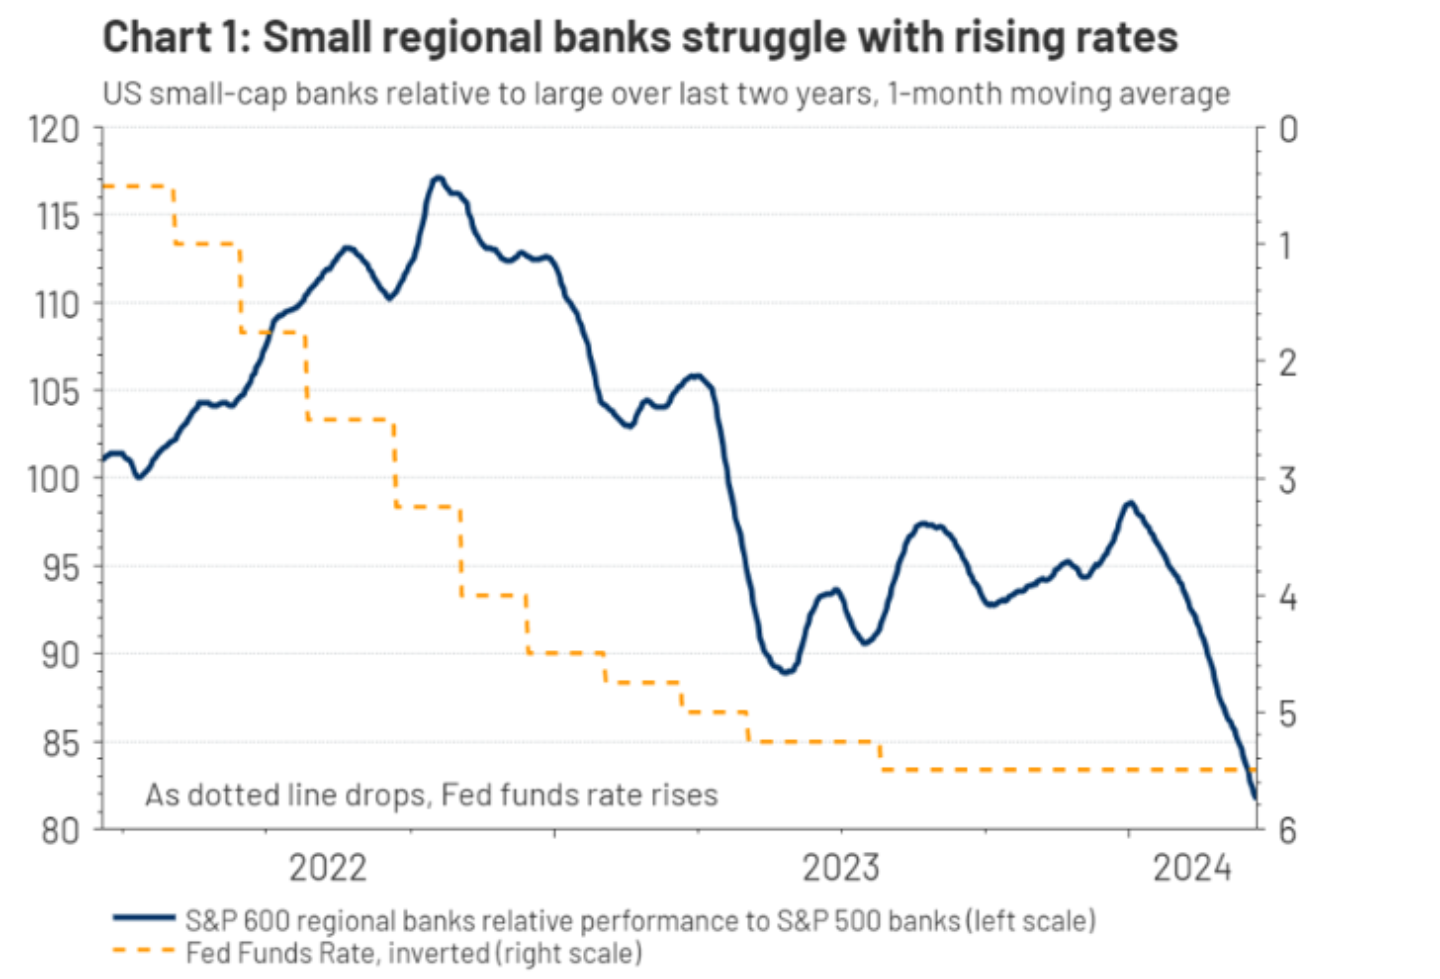
As discussed in our top-down analysis last week, rising interest rates have created a negative feedback loop for smaller financial companies. Looking at Chart 1 below, we see relative performance between small regional and large diversified banks on the left-hand axis and the inverse (lower means rising rates) of the Fed Funds Rate on the right-hand axis. While small-cap banks were able to outperform during the first couple of hikes, once the market understood that the Fed was going to continue their rate hikes, you can see the underperformance of small, regional banks to their large-cap peers begin.
Looking at the mechanics of this feedback loop more closely:
Step 1: Rising rates slows lending. Smaller banks have large Treasury and Mortgage holdings that have significant unrealized losses from the sharp increase in interest rates. Due to accounting rules, banks are able to avoid realizing those losses if they hold the bonds to maturity, which helps with solvency issues but clogs up balance sheets and restricts lending.
Step 2: Slower lending puts pressure on borrowers. Lending restrictions create a ripple effect, by which some companies that need capital cannot access it or cannot afford it. This combination of higher rates and restricted access to capital increases the risk of default on loans.
Step 3: Rising defaults slow loans further. The increased default risk forces banks to raise their loan loss provisions, which in turn creates additional stress on the small banks’ balance sheets, which then repeats the feedback loop.
While these macro factors also affect larger banks, they have a higher percentage of their revenue and profit coming from securitization of loans and other non-interest rate related activities, like trading, asset management, and investment banking. These are all activities that are less exposed to interest rates. Thus, we believe larger banks adapt to rising rates better than smaller ones.
Technology: Large Tech Companies Often Have a Moat, Smaller Ones Often Don’t
When comparing small and large technology companies, we believe that the companies with the most favorable economic profitability and widest economic ‘moats’ are much more prevalent in the large-cap space. A ‘moat’ is a sustainable competitive advantage that a company or industry has that allows it to remain profitable for an extended period. For technology, the moats that we believe make certain large-cap companies so profitable are:
- Free Cash Flow: In a higher interest rate environment, where capital is constrained, the large amounts of ‘free cash flow’ (cash left over after paying for operating expenses and capital expenditures) generated by mega-cap technology companies becomes more attractive. These cash flows allow them to return capital to shareholders, acquire emerging competitor technologies in their infancy, and continue to invest in innovation and research and development (R&D) to maintain their position over time, without having to enter capital markets.
- Staple-like Spend: Mega-cap tech companies tend to have large installed customer bases that the tech company can easily up-sell into.
- Attractive organic growth: Mega-caps also tend to have higher exposure to high growth areas such as artificial intelligence (AI) and the Public Cloud than smaller ones, in our view.
While these companies are more abundant within the large-cap technology sector, not every large-cap technology company fits the bill. Instead, we believe that this is a space where security selection is important, which we outlined in our Strategic View on 2/21/24.
Healthcare: Prefer Larger Firms with Diversified Pipelines Over Smaller, Riskier Biotechs
Like technology, larger healthcare companies have well-capitalized balance sheets that we believe are the key to their performance moving forward. Larger healthcare companies can afford to make big R&D investments to drive innovation, which in turn fuels earnings growth. As an example of why this is harder for small-cap healthcare companies than large, diversified ones, consider some of the challenges for a small biotech pharmaceutical company:
- Higher borrowing rates: As discussed above, small-cap companies face higher costs when borrowing. This is a particularly big headwind for smaller biotech companies, due to the capital-intensive nature of their business.
- High capital requirements: The cost of getting a new drug to the market can often be close to a billion dollars. Larger companies tend to have more free cash flow to cover this expense versus smaller ones.
- Clinical trial and pipeline risk: Smaller companies tend to be highly dependent on single products and their clinical trial success, while larger companies have more room for failure due to more diversified pipelines.
Just like a diversified portfolio can help an investor limit losses in any one segment, larger healthcare companies’ inherent diversification of pipeline and product allows them to better weather an adverse outcome in any one investment they make.
The Exception to the Rule: Small-Cap Industrials Are Attractive, in our View
In our view, a macro environment of elevated but stable inflation is attractive for cyclical business models. Inflation allows industrial companies to raise prices, which drives companies’ revenues, while their cost structure is more fixed. In such environments cyclical companies are likely to experience a ramp up in their returns to shareholders as revenue accelerates against a fixed cost base – we call this operating leverage. This is the ultimate driver of value companies beating growth companies. When comparing large- and small-cap industrials, we see a few dominant themes:
- Focus: In an inflationary environment, we prefer the singular scope of smaller Industrials, relative to their large-cap peers. This is because large-cap companies tend to have more, often unrelated, business lines. This results in additional overhead, making it more difficult for them to take full advantage of operating leverage in the current environment.
- Cost Structure: Small-cap industrials tend to have a more straightforward cost structure with fewer “service” business lines, which tend to have higher variable costs. Fixed cost structures have worked against them in the low growth environment of the last decade, but we believe they will help them in our most likely economic scenario going forward.
Because of these two features, we believe that small-cap industrials can utilize inflation-driven revenues to generate profits more effectively than large-cap industrials.
Conclusion: Bottom-up View Confirms What We See From the Top-Down
At RiverFront, we often discuss how we blend top-down ‘macro’ research with bottom-up ‘micro’ research; this week’s discussion of small-cap equities is a good example of this integrated approach. Our top-down team first identified issues with the macroeconomic landscape for small-cap investing. From there, our bottom-up team began analyzing companies in this space. This company-specific research was to ensure our team had a complete picture when making investment decisions. It turned out in this case that our micro views of small-cap companies lined up with our macro views on the economy in most areas. However, we were able to identify an opportunity in small-cap industrials as an attractive investment and have positioned our longer-horizon portfolios accordingly.
For more news, information, and strategy, visit the ETF Strategist Channel.
Risk Discussion: All investments in securities, including the strategies discussed above, include a risk of loss of principal (invested amount) and any profits that have not been realized. Markets fluctuate substantially over time and have experienced increased volatility in recent years due to global and domestic economic events. Performance of any investment is not guaranteed. In a rising interest rate environment, the value of fixed-income securities generally declines. Diversification does not guarantee a profit or protect against a loss. Small-, mid- and micro-cap companies may be hindered as a result of limited resources or less diverse products or services and have therefore historically been more volatile than the stocks of larger, more established companies. Please see the end of this publication for more disclosures.
Important Disclosure Information:
The comments above refer generally to financial markets and not RiverFront portfolios or any related performance. Opinions expressed are current as of the date shown and are subject to change. Past performance is not indicative of future results and diversification does not ensure a profit or protect against loss. All investments carry some level of risk, including loss of principal. An investment cannot be made directly in an index.
Information or data shown or used in this material was received from sources believed to be reliable, but accuracy is not guaranteed.
This report does not provide recipients with information or advice that is sufficient on which to base an investment decision. This report does not take into account the specific investment objectives, financial situation or need of any particular client and may not be suitable for all types of investors. Recipients should consider the contents of this report as a single factor in making an investment decision. Additional fundamental and other analyses would be required to make an investment decision about any individual security identified in this report.
Chartered Financial Analyst is a professional designation given by the CFA Institute (formerly AIMR) that measures the competence and integrity of financial analysts. Candidates are required to pass three levels of exams covering areas such as accounting, economics, ethics, money management and security analysis. Four years of investment/financial career experience are required before one can become a CFA charterholder. Enrollees in the program must hold a bachelor’s degree.
All charts shown for illustrative purposes only. Technical analysis is based on the study of historical price movements and past trend patterns. There are no assurances that movements or trends can or will be duplicated in the future.
Stocks represent partial ownership of a corporation. If the corporation does well, its value increases, and investors share in the appreciation. However, if it goes bankrupt, or performs poorly, investors can lose their entire initial investment (i.e., the stock price can go to zero). Bonds represent a loan made by an investor to a corporation or government. As such, the investor gets a guaranteed interest rate for a specific period of time and expects to get their original investment back at the end of that time period, along with the interest earned. Investment risk is repayment of the principal (amount invested). In the event of a bankruptcy or other corporate disruption, bonds are senior to stocks. Investors should be aware of these differences prior to investing.
In general, the bond market is volatile, and fixed income securities carry interest rate risk. (As interest rates rise, bond prices usually fall, and vice versa). This effect is usually more pronounced for longer-term securities). Fixed income securities also carry inflation risk, liquidity risk, call risk and credit and default risks for both issuers and counterparties. Lower-quality fixed income securities involve greater risk of default or price changes due to potential changes in the credit quality of the issue. Foreign investments involve greater risks than U.S. investments, and can decline significantly in response to adverse issuer, political, regulatory, market, and economic risks. Any fixed-income security sold or redeemed prior to maturity may be subject to loss.
Technology and internet-related stocks, especially of smaller, less-seasoned companies, tend to be more volatile than the overall market.
Index Definitions:
Standard & Poor’s (S&P) 500 Index measures the performance of 500 large cap stocks, which together represent about 80% of the total US equities market.
Standard & Poor’s (S&P) 600 Index tracks a broad range of small-sized companies that meet specific liquidity and stability requirements. This is determined by specific metrics such as public float, market capitalization, and financial viability, among other factors.
Definitions:
The federal funds rate is the rate banks charge each other for lending their excess reserves or cash. Some banks have excess cash, while other banks might have short-term liquidity needs. The fed funds rate is a target rate set by the Federal Reserve Bank and is usually the basis for the rate that commercial banks lend to each other.
A loan loss provision is an income statement expense set aside as an allowance for uncollected loans and loan payments. This provision is used to cover different kinds of loan losses such as non-performing loans, customer bankruptcy, and renegotiated loans that incur lower-than-previously-estimated payments. Loan loss provisions are then added to the loan loss reserves, a balance sheet item that represents the total amount of loan losses subtracted a company’s loans.
The term cash flow refers to the net amount of cash and cash equivalents being transferred in and out of a company. Cash received represents inflows, while money spent represents outflows.
Free cash flow to equity is a measure of how much cash is available to the equity shareholders of a company after all expenses, reinvestment, and debt are paid. FCFE is a measure of equity capital usage.
Small-, mid- and micro-cap companies may be hindered as a result of limited resources or less diverse products or services and have therefore historically been more volatile than the stocks of larger, more established companies.
Mega cap is a designation for the largest companies in the investment universe as measured by market capitalization. While the exact thresholds change with market conditions, mega cap generally refers to companies with a market capitalization above $200 billion.
Operating leverage is a cost-accounting formula (a financial ratio) that measures the degree to which a firm or project can increase operating income by increasing revenue. A business that generates sales with a high gross margin and low variable costs has high operating leverage.
RiverFront Investment Group, LLC (“RiverFront”), is a registered investment adviser with the Securities and Exchange Commission. Registration as an investment adviser does not imply any level of skill or expertise. Any discussion of specific securities is provided for informational purposes only and should not be deemed as investment advice or a recommendation to buy or sell any individual security mentioned. RiverFront is affiliated with Robert W. Baird & Co. Incorporated (“Baird”), member FINRA/SIPC, from its minority ownership interest in RiverFront. RiverFront is owned primarily by its employees through RiverFront Investment Holding Group, LLC, the holding company for RiverFront. Baird Financial Corporation (BFC) is a minority owner of RiverFront Investment Holding Group, LLC and therefore an indirect owner of RiverFront. BFC is the parent company of Robert W. Baird & Co. Incorporated, a registered broker/dealer and investment adviser.
To review other risks and more information about RiverFront, please visit the website at riverfrontig.com and the Form ADV, Part 2A. Copyright ©2024 RiverFront Investment Group. All Rights Reserved. ID 3467692