
By Gary Stringer, Kim Escue and Chad Keller, Stringer Asset Management
Stringer Asset Management is risk-aware when looking at the fixed income market due to the asymmetrical returns associated with the asset class. The risk of loss from the fixed income asset class can be larger than the potential upside. Therefore, we place an emphasis on the relative risk we are taking on to achieve excess returns, rather than focus solely on the excess return over the risk-free rate.
Some fixed income risk factors are fairly straight forward. For example, interest rate risk as measured by duration is relatively easy to value. In the absence of options (e.g. calls, puts, and sinking funds), the longer the maturity of a bond, the longer the duration. In a normal environment, investors receive a premium over the risk-free rate as they move out on the yield curve and take on more uncertainty with respect to inflation and other factors.
As market conditions change, we experience different movements across the yield curve and generally we can quantify how these curve shifts will impact our basic U.S. Treasury holdings.
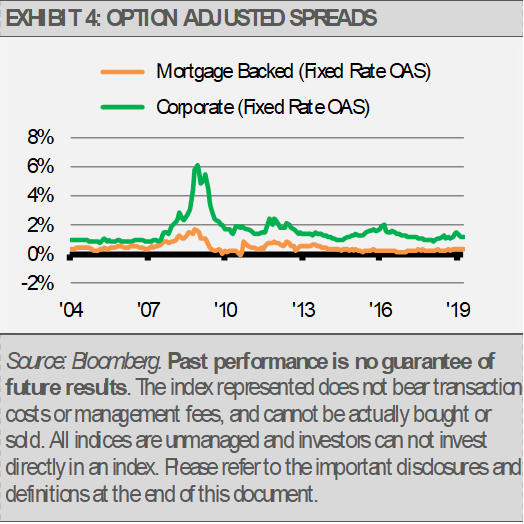
As we layer on additional risk factors, such as credit risk and options, we can estimate a value for them based on historical spreads and performance to determine if we are getting paid fairly for assuming those risks.
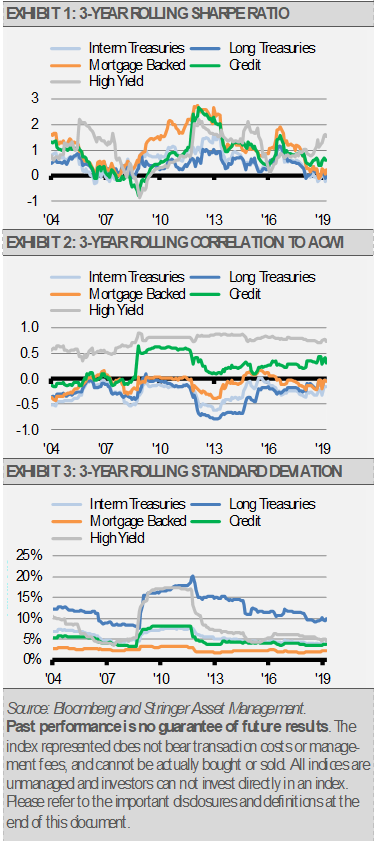
The starting point for our modeling is the Treasury market and, in particular, the 3-Month Treasury Bill. In a normal environment with a positively sloped yield curve, an investor receives an incrementally higher premium for the longer the maturity of a bond. Longer bonds normally have a higher premium because they are impacted to a greater degree by inflation risk as well as supply and demand, which can cause rates to move. Also, longer duration bonds experience deeper price declines when rates rise. Therefore, we emphasize short to intermediate bonds as they tend to provide a more consistent premium on a risk-adjusted basis when considering standard deviation and downside risk (the following charts compare the Sharpe Ratio, a measure of risk-adjusted returns, and other risk measures for different maturity U.S. Treasury bonds).
On average, we think the intermediate area of the curve offers the best risk-adjusted value. Additionally, we favor investment-grade credit in our strategic fixed income allocations, which exposes a portfolio to corporate risks, such as credit rating changes. Taking on investment-grade credit risk provides a yield advantage and the potential for upside with still enough rate sensitivity to help offset equity risk.
We tend to first favor investment-grade bonds over high yield as strategic holdings. High yield bonds are more likely to be impacted by actual defaults, higher liquidity premiums, and tend to be more equity sensitive (see exhibit 2, the correlation to the global equity MSCI ACWI Index). Our philosophy with respect to a core fixed income allocation is that the holdings should help mitigate equity risk, so taking on additional equity sensitivity in the fixed income allocation makes little sense in our opinion.
In addition to interest rate risk and credit risk, we implement a long-term allocation to mortgage-backed securities. These bonds tend to compensate investors for the call option risk they include. Option risks include the prepayment of principal by homeowners due to unplanned events, such as a mortgages being paid off early or the sale of a home. Investors are also compensated for extension risk as interest rates rise and the pre-payment option becomes less attractive, which results in an extending duration. In general, bonds structured with call options protect better to the downside due to the price compression they experience when interest rates fall. Over time, they tend to provide attractive risk-adjusted results in our opinion.
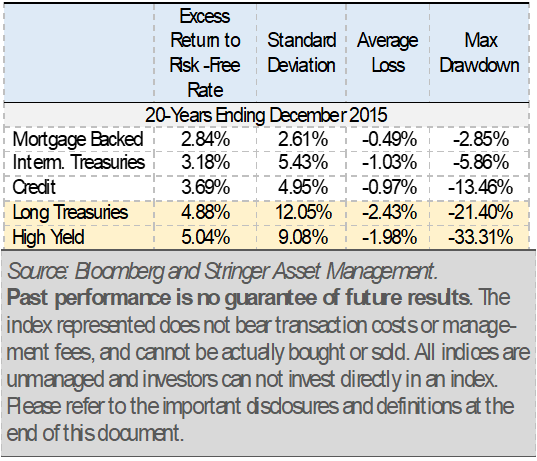
The following table shows that, over time, mortgage-backed securities, investment-grade credit, and intermediate-term Treasuries offer compelling risk-adjusted returns. High Yield bonds and longer-dated Treasuries can suffer bouts of higher volatility and larger draw-downs, thus making them unattractive strategic holdings in our view. When investing for total return, we save these investments for our tactical allocations.
Finally, we realize that the bond market changes over time and the risk and potential rewards of this market also change. Therefore, we take a dynamic approach with our allocations through strategic shifts and look to add value tactically through identifying momentum and value opportunities that arise. For example, high yield and longer duration U.S. Treasury bonds make sense tactically and can add value as momentum builds in favor of different risks over shorter periods. Additionally, particular sectors of the bond market may become appealing on a relative value basis due to attractive yields on a historical basis or relative to other sectors.
Using this philosophy as the framework for how we position our fixed income allocations, we will generally keep our duration tilted below the benchmark to slightly longer than the Bloomberg Barclays Aggregate Bond Index. Currently, we believe there are no catalysts to drive rates substantially higher, and therefore are neutral the benchmark’s full intermediate duration. We think that our duration positioning is optimal with low inflationary pressures and the risk that the U.S. Federal Reserve (Fed) might make a policy mistake and continue raising short rates. We would want to see more certainty out of the Fed before taking more short duration exposure.
Within our income-oriented strategies, we are emphasizing investment grade corporate bonds, mortgage-backed securities, and taxable municipal bonds as well as non-traditional fixed allocations that offer a yield advantage over the Bloomberg Barclays Aggregate Index. Though we think that spreads are about average relative to historical norms, we continue to emphasize these sectors due to their yield advantage, which is consistent with our income objective. We compliment these core positions with non-traditional income generating allocations, such as covered call writing, and diversified allocations including MLPs, and REITs.
This article was written by Gary Stringer, CIO, Kim Escue, Senior Portfolio Manager, and Chad Keller, COO and CCO at Stringer Asset Management, a participant in the ETF Strategist Channel.
DISCLOSURES
Any forecasts, figures, opinions or investment techniques and strategies explained are Stringer Asset Management, LLC’s as of the date of publication. They are considered to be accurate at the time of writing, but no warranty of accuracy is given and no liability in respect to error or omission is accepted. They are subject to change without reference or notification. The views contained herein are not be taken as an advice or a recommendation to buy or sell any investment and the material should not be relied upon as containing sufficient information to support an investment decision. It should be noted that the value of investments and the income from them may fluctuate in accordance with market conditions and taxation agreements and investors may not get back the full amount invested.
Past performance and yield may not be a reliable guide to future performance. Current performance may be higher or lower than the performance quoted.
The securities identified and described may not represent all of the securities purchased, sold or recommended for client accounts. The reader should not assume that an investment in the securities identified was or will be profitable.
Data is provided by various sources and prepared by Stringer Asset Management, LLC and has not been verified or audited by an independent accountant.
Index Definitions:
The Bloomberg Barclays US Treasury 5-10 Yr TR Index is designed to track the investment results of an index comprised of U.S. Treasury bonds with remaining maturities of 5 to 10 years.
The Bloomberg Barclays US Treasury 20+ Yr TR Index is designed to track the investment results of an index comprised of U.S. Treasury bonds with remaining maturities of greater than 20 years.
The Bloomberg Barclays US Credit TR Index is designed to track the investment results of an index comprised of the investment grade, US dollar-denominated, fixed-rate, taxable corporate and government related bond markets. It is composed of the US Corporate Index and a non-corporate component that includes foreign agencies, sovereigns, supranationals and local authorities.
The Bloomberg Barclays US MBS TR Index is designed to track the investment results of an index comprised of agency mortgage pass-through securities (no longer incorporates hybrid ARM) guaranteed by Ginnie Mae (GNMA), Mae (FNMA), and Freddie Mac (FHLMC). The index is constructed by grouping individual TBA- deliverable MBS pools into aggregates or generics based on program, coupon and vintage.
The Bloomberg Barclays US Corporate High Yield TR Index is designed to track the investment results of an index comprised of the USD-denominated, high yield, fixed-rate corporate bond market. Securities are classified as high yield if the middle rating of Moody’s, Fitch and S&P is Ba1/BB+/BB+ or below. Bonds from issuers with an emerging markets country of risk, based on Barclays EM country definition, are excluded.
The MSCI ACWI (Net) Index is a free float-adjusted market capitalization weighted index that is designed to measure the equity market performance of developed and emerging markets. The MSCI ACWI Index consists of 23 developed and 23 emerging market country indexes. Net total return includes the reinvestment of dividends after the deduction of withholding taxes, using a tax rate applicable to non-resident institutional investors who do not benefit from double taxation treaties.
