
With this year’s equity market rally so narrowly focused on a few technology related companies while economic and market uncertainties persist, many investors are struggling with the placement of their investment dollars. Some investors are parking excessive amounts of money in money market funds to capture attractive current yields.
As the U.S. Federal Reserve (Fed) began increasing short-term interest rates, assets in retail money market funds sored. With short-term interest rates much more attractive than in the recent past, we think that money market funds and short-term Treasuries deserve an allocation in investors’ portfolios. However, such a large move into money market funds over a short period of time suggests that investors may be over allocating to money market funds and T-Bills while perhaps not considering the implications and potential opportunity costs associated with holding such an overweight to them.
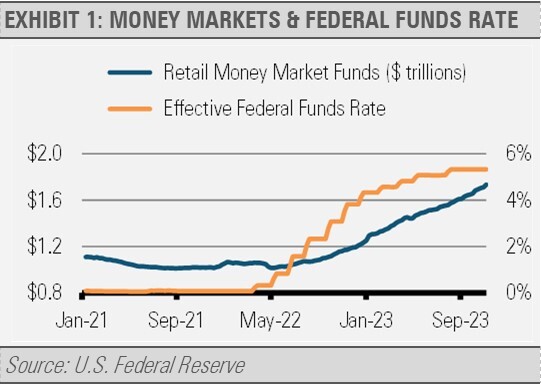
For example, while money market funds pay attractive yields today, the income provided by these funds will drop precipitously as soon as the Fed begins to lower interest rates. Conversely, allocations to investment grade intermediate fixed income are unlikely to see a significant reduction in current income when the Fed cuts rates. This positioning exhibits more income stability because these portfolios would have locked in today’s attractive rates for longer. Additionally, intermediate fixed income investors may also benefit from capital appreciation when the value of their bonds increases as interest rates fall.
We can use duration of a bond or bond portfolio to illustrate this point. Duration measures the sensitivity of a bond or bond portfolio to changes in the level of interest rates. In general, the value of shorter-duration portfolios is less sensitive to changes while the value of longer-duration portfolios is more sensitive to changes in interest rates. For example, a 1% increase or decrease in interest rates basically results in the price of a vanilla bond or a bond portfolio changing approximately 1% in the opposite direction for every year of duration. So, if a bond portfolio has a duration of 5 years and interest rates increase by 1%, the bond portfolio’s value will decline by approximately 5% in total. Conversely, the price of bond portfolio with a duration of 5 years should increase by roughly 5% with a 1% drop in interest rates.
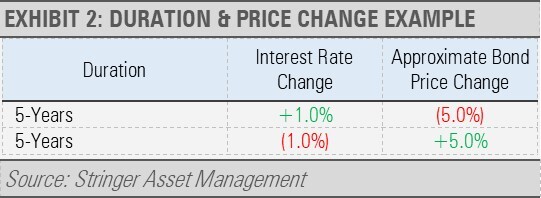
Note that changes in interest rates will not immediately impact the current income generated from a 5-year duration bond portfolio, only the price of the bond or bond portfolio with change.
INVESTMENT IMPLICATIONS
While holding assets in money market funds or T-Bills has its merits, our Three Layers of Risk Management framework leads us to additional opportunities that have the potential for attractive gains and principal protection.
Our work suggests that the investment grade fixed income space looks very attractive. As interest rates have risen and bond prices have fallen, we think core intermediate duration fixed income is set to offer attractive returns for years to come. Within that space, we favor areas like commercial mortgage-backed securities and taxable municipal bonds, which offer compelling yields and high quality.
In addition, although the S&P 500 Index looks expensive relative to earnings and revenue, this valuation is largely driven by the appreciation of a few technology-oriented companies. As a result, we are finding investment opportunities in more attractively priced equities outside of technology.
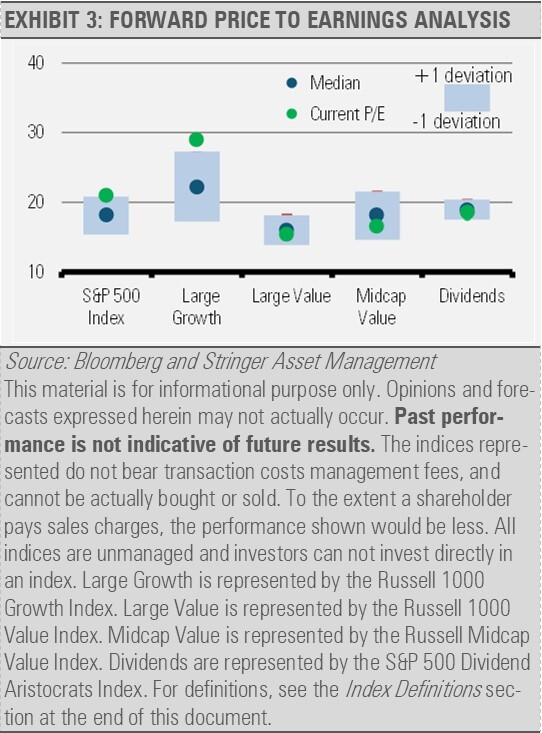
Our Strategies currently emphasize dividend paying equities, the health care sector, and master limited partnerships (MLPs) for their attractive current valuations and consistent dividend income. Interestingly, according to the S&P Global US Sector PMI the health care sector has seen the strongest growth in business activity of all sectors for the last two consecutive months.
In summary, we are finding a broad array of investment opportunities that can potentially provide both attractive returns and protection during periods of uncertainty.
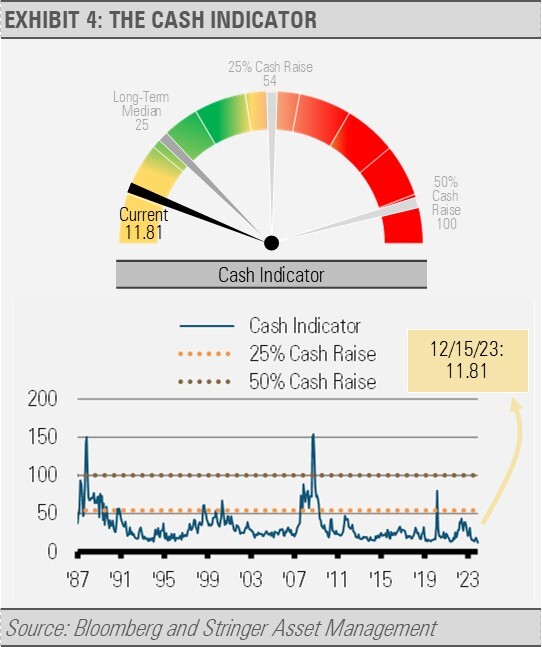
CASH INDICATOR
The Cash Indicator (CI) has dropped back to a very low level as equity market volatility has fallen. So much complacency in the financial markets is exceptionally rare. As a result, we expect an eventual snap back in volatility.
DISCLOSURES
Any forecasts, figures, opinions or investment techniques and strategies explained are Stringer Asset Management, LLC’s as of the date of publication. They are considered to be accurate at the time of writing, but no warranty of accuracy is given and no liability in respect to error or omission is accepted. They are subject to change without reference or notification. The views contained herein are not to be taken as advice or a recommendation to buy or sell any investment and the material should not be relied upon as containing sufficient information to support an investment decision. It should be noted that the value of investments and the income from them may fluctuate in accordance with market conditions and taxation agreements and investors may not get back the full amount invested.
Past performance and yield may not be a reliable guide to future performance. Current performance may be higher or lower than the performance quoted.
The securities identified and described may not represent all of the securities purchased, sold or recommended for client accounts. The reader should not assume that an investment in the securities identified was or will be profitable.
Data is provided by various sources and prepared by Stringer Asset Management, LLC and has not been verified or audited by an independent accountant.
Index Definitions:
Russell 1000 Growth Index – This Index measures the performance of the large cap growth segment of the U.S. equity universe. It includes those Russell 1000 companies with relatively higher price-to-book ratios, higher I/B/E/S forecast medium term growth and higher sales per share historical growth. The Index is constructed to provide a comprehensive and unbiased barometer for the large-cap growth segment. The Index is completely reconstituted annually to ensure new and growing equities are included and that the represented companies continue to reflect growth characteristics.
Russell 1000 Value Index – This Index measures the performance of the large cap value segment of the U.S. equity universe. It includes those Russell 1000 companies with relatively lower price-to-book ratios, lower I/B/E/S forecast medium term growth and lower sales per share historical growth. The Index is constructed to provide a comprehensive and unbiased barometer for the large-cap value segment. The Index is completely reconstituted annually to ensure new and growing equities are included and that the represented companies continue to reflect value characteristics.
Russell Midcap Value Index – This Index measures the performance of the midcap value segment of the U.S. equity universe. It includes those Russell Midcap Index companies with relatively lower price-to-book ratios, lower I/B/E/S forecast medium term growth and lower sales per share historical growth. The Index is constructed to provide a comprehensive and unbiased barometer of the mid-cap value market. The Index is completely reconstituted annually to ensure larger stocks do not distort the performance and characteristics of the true midcap value market.
S&P 500 Index – This Index is a capitalization-weighted index of 500 stocks. The Index is designed to measure performance of a broad domestic economy through changes in the aggregate market value of 500 stocks representing all major industries.
S&P 500 Equal Weight Index – This Index is the equal-weight version of the widely-used S&P 500 Index. The Index includes the same constituents as the capitalization weighted S&P 500 Index, but each company in the Equal Weight Index is allocated a fixed weight – or +0.2% of the index total at each quarterly rebalance.
S&P 500 Dividend Aristocrats Index – This Index tracks companies within the S&P 500 Index that have a record of raising their dividends for at least 25 consecutive years. Each company is equally weighted within the Index. S&P will remove companies from the Index when they fail to increase dividend payments from the previous year. The Index’s universe includes stocks with a float-adjusted market capitalization of at least $3 billion and an average daily trading volume of at least $5 million, in addition to consistently increasing dividend payments. The index requires a minimum of 40 companies.
For more news, information, and analysis, visit the ETF Strategist Channel.
