
Summary
Within the context of the S&P 500’s continuing uptrend, and because of the bulls run on Wall Street last week (and in Pamplona, Spain recently), areas of potential selling pressure (resistance) loom overhead. This is coupled with the arrival of earnings season. Unless this is resolved above the areas of resistance, we think a period of sideways consolidation or minor pullback shouldn’t be surprising.
Lines = Potential Pressure
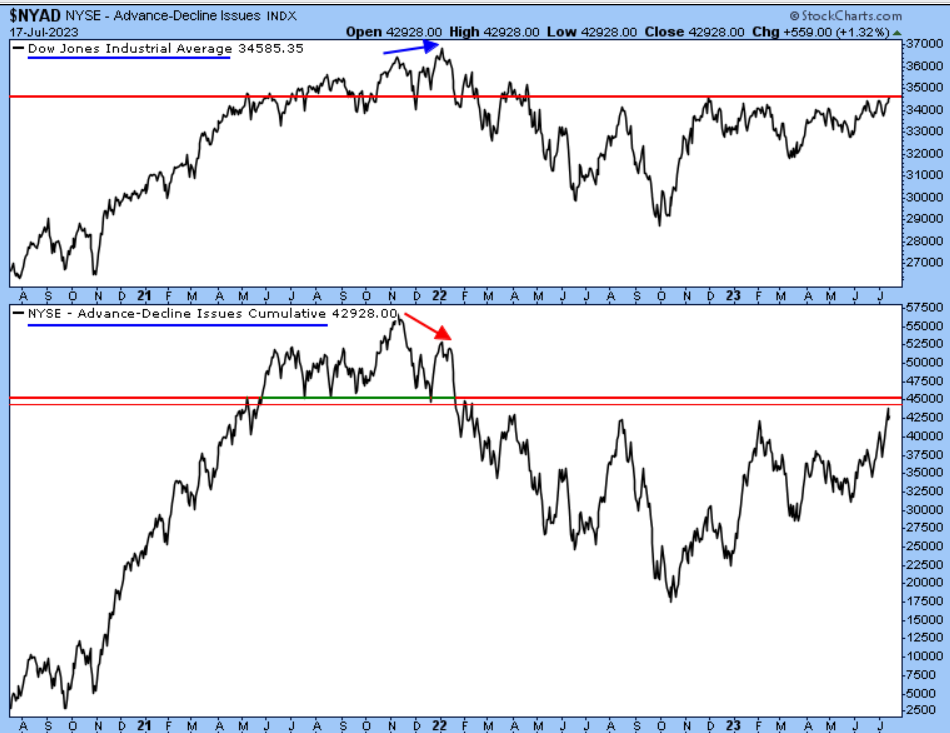
Figure 1: NYSE Advance – Decline Line (all issues) and DJIA. | While this is a much better indicator for discerning tops, it is useful to discern upside participation levels, which have occurred since the beginning of June. Currently, the A/D Line has moved into an area of resistance. The key now is, will it pivot lower or resolve higher?
We’re also monitoring:
- Seasonality (NDR’s S&P 500 Cycle Composite for 2023): Favorable seasonal factors taper off until Q4. (Figure 2)
- S&P 500 support: SP500 at 4444 (gap, very short-term), 4385 +/- (short-term), 4325 to 4300.
- S. Dollar Index: While oversold short-term, the index has broken down longer-term, which has many cross-asset ramifications ranging from equities (historically supportive overall, including overseas versus domestic), commodities (historically supportive), and currencies. (Figure 3)
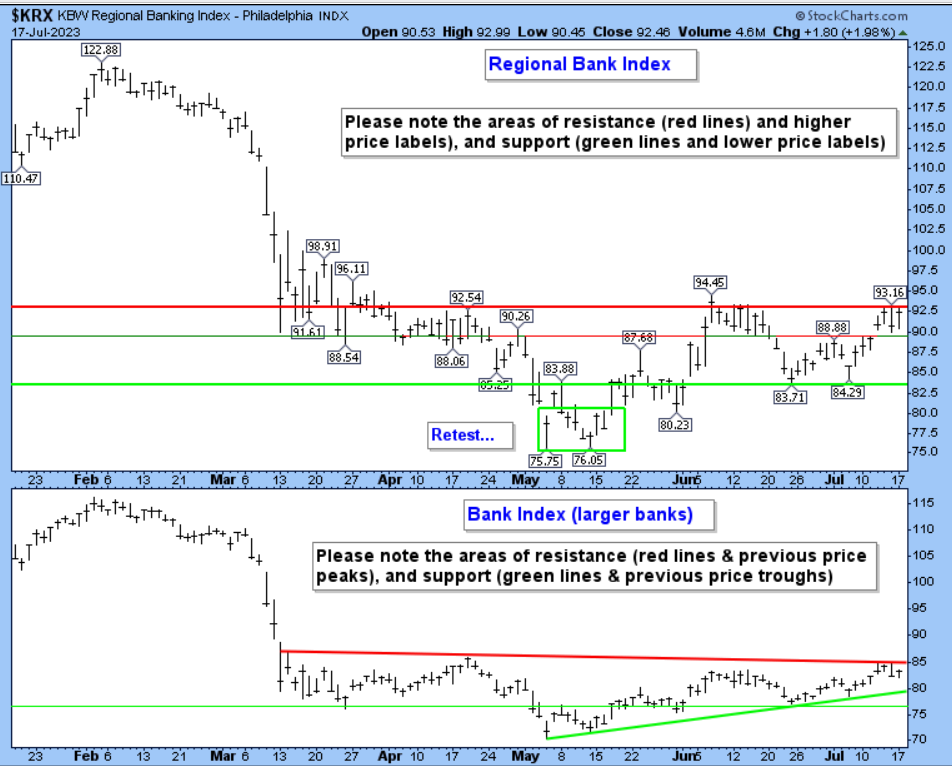
- Banks: Big and Regionals remain range bound and at resistance. (Figure 4)
- Speaking of “Range Bound,” as highlighted in last week’s report, the 10-Year U.S. Treasury Yield Index ($TNX/37.97 – 3.79%) remains “Stuck in the Middle with You” (Stealers Wheel, 1972), between resistance at 41 +/- and support at 33+/-, including higher support at 36 to 35.5. Please reach out for an up-to-date chart of TNX.
Figure 2: S&P 500 Cycle Composite for 2023. | We note that outside forces can overwhelm cycles and seasonal trends; therefore, we view this as a secondary indicator. Currently, it shows that headwinds are building.
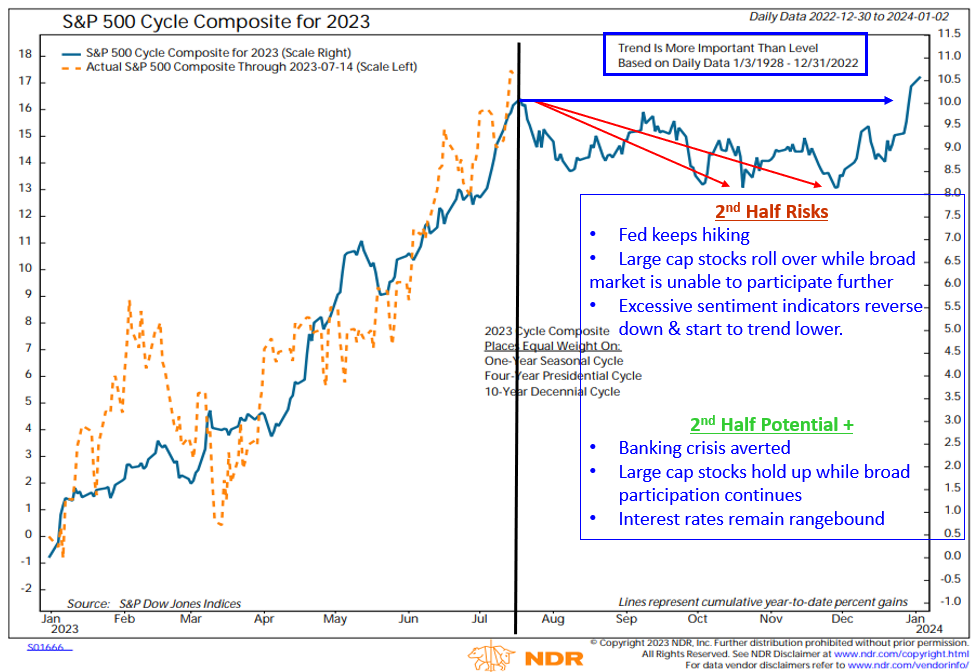
Figure 3. U.S. Dollar Index with Momentum (MACD) – weekly data. | Although we’ve seen a short-term oversold bounce, and it now resides at support, further downside probing is in the cards.
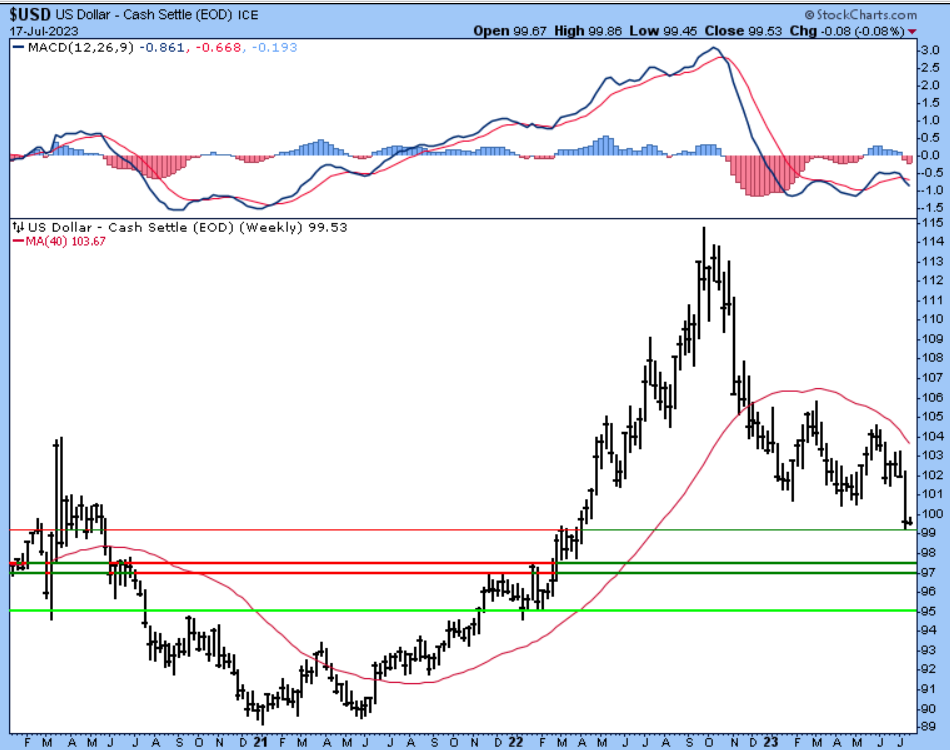
Figure 4. Bank Index and Regional Bank Index – daily chart, post-initial crisis. | A favorable resolve above resistance will increase Small Cap proxies’ odds of a bullish move.
Please let me know if you would like to schedule a call to go over the process and discipline underpinning our Smart Sector with Catastrophic Stop, Smart Sector International, and/or Smart Sector Fixed Income strategies.
Day Hagan Asset Management appreciates being part of your business, either through our research efforts or investment strategies. Please let us know how we can further support you.
Art Huprich, CMT®
Chief Market Technician
Day Hagan Asset Management
—Written 07.17.2023. Chart Source: Stockcharts.com unless otherwise noted.
For more news, information, and analysis, visit the ETF Strategist Channel.
