

We have said this many times before, but liquid security or market index is driven by the law of supply and demand. Changes in supply and demand are driven by the emotions, beliefs, and convictions of investors. As we all know, those emotions can change quickly and unpredictably.
Source: American Association of Individual Investors Investor Sentiment Survey. URL: www.aaii.com/sentimentsurvey
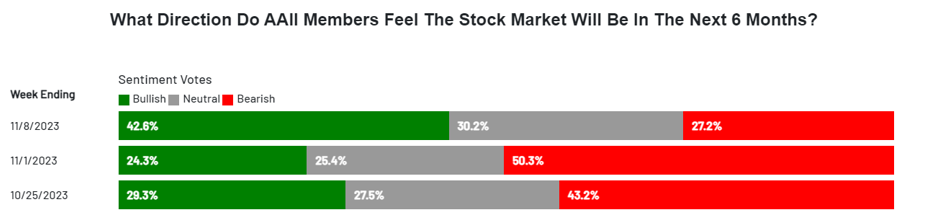
The latest survey saw the percentage of bullish investors jump from 24% to 42% (+18.3%) and the percentage of bearish investors fall from 50% to 27% (-23%).
The AAII sentiment survey dates back to 1987 and has now been conducted for 1,892 weeks. The 18% jump in bullish sentiment is the 22nd largest single-week increase since the survey’s inception, and the decrease in bearish sentiment is the 4th largest single-week decrease.
It appears that the small rally over the last two weeks was enough to dramatically change the moods of investors. It should be noted that investor sentiment is a contrarian indicator. According to the American Association of Individual Investors, “a contrarian indicator tells investors that it may be a good time to go in the opposite direction of the herd.” In other words, high levels of pessimism can precede rallies and high levels of optimism can precede declines.
A Quick Study
As we stated at the beginning of this update, investor emotions can change quickly and unpredictably. This is particularly true when markets are volatile. After all, a volatile market move over the course of a few days was enough to completely flip the sentiment of investors.
Looking at the twenty-five largest single-week shifts in market sentiment since 1987, most large shifts occurred in the middle of market declines. The table below shows the market’s average percentage off a high when one of the 25 largest shifts in sentiment occurred. In other words, a big swing in investor sentiment is more likely to occur when markets are volatile. In fact, of these 100 largest shifts, 67 of them occurred between 2000 and 2010, where the S&P 500 experienced two separate declines of -50%.
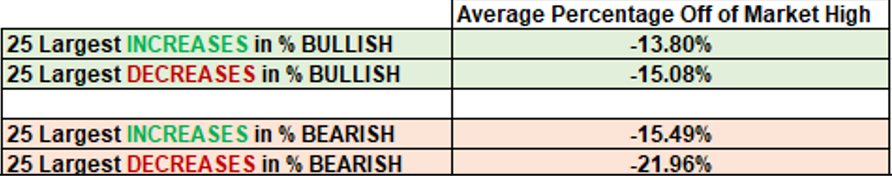
Source: Canterbury Investment Management using data provided by AAII Investor Sentiment Survey.
What happens following a large single-week shift in market sentiment? The results are mixed. When markets saw a sharp increase in bullish sentiment and sharp decrease in bearish sentiment, sometimes the market was slightly higher in the next six months, and sometimes it was lower. It just depended on whether the shift occurred at the beginning, end, or in the middle of a volatile market. Remember, you can’t predict the future. All we know is that right now, markets are volatile.
Bottom Line
Right now, we know that markets are volatile. Investor emotions have dramatically rotated a few times in the last three months, and many times over the course of the last two years. Volatile markets create volatile emotions.
In other market news, the markets are still being led by technology-related stocks. These stocks make up the largest percentage of the S&P 500. While the S&P 500 was up a little more than +1% last week, the equal-weight S&P 500 index was down slightly. The Russell 2000, which measures small-cap stocks, was down -3.1% last week. Large technology stocks have skewed the market’s health.
For investors, this remains a risky market environment. Volatility has increased. The large upward move that the markets experienced two weeks ago is typical in a volatile environment. Right now, Canterbury’s adaptive portfolio has diversified holdings and is maintaining low volatility.
For more news, information, and analysis, visit the ETF Strategist Channel.