
By Francisco Rodriguez; Investment Analyst
Factor Investing
Risk management and diversification are crucial elements of professional investment management. For many, including this author, also believe that a strategic emphasis on factor investing will add value to portfolios over time, especially during more difficult times in the market.
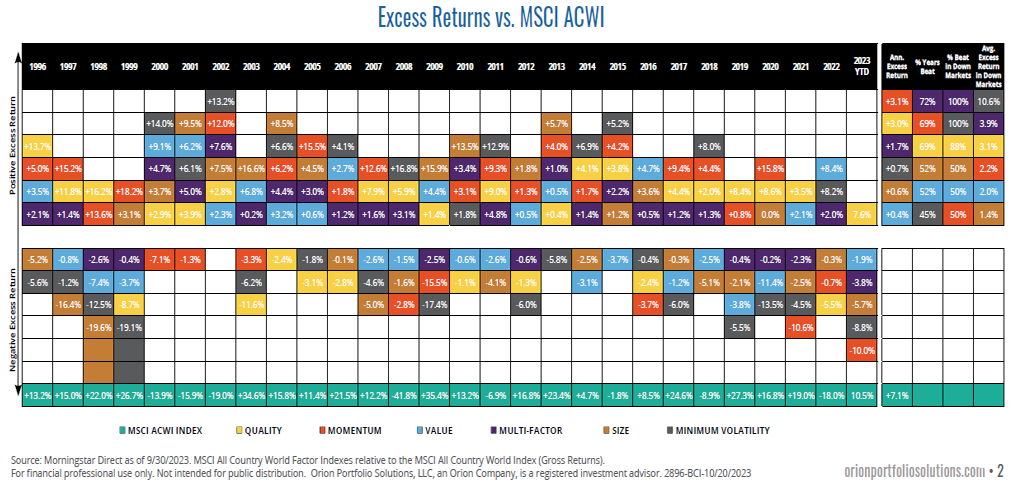
Since 1996 for example, the average factor that we look at (quality, momentum, value, size, and volatility), has had an average excess return to the stock market of 1.1%. The average factor outperformed 64% of the time and the multi-factor (an equal weight of the five factors) outperformed 72% of the time.
When the stock market was lower, however, the numbers were even better. The average factor in those 8 years where the stock market had a loss had an average excess return to the stock market of 3.9%. The average factor outperformed 68% of the time, but the multi-factor (again the average of the five factors) outperformed 100% of the time.
Quality Factor
Quality has been top of mind for many investors as we continue in this new ‘higher for longer’ interest market environment. Generally speaking, quality companies are those that have low leverage, stable earnings, and high profitability, which makes sense as to why quality trades at a valuation premium to the rest of the market most of the time. It is also no surprise that high-quality stocks have consistently delivered high-risk adjusted returns. From 2000 to 2022 quality has generated excess returns to benchmark (MSCI ACWI Index) in 15 out of the 23 years with an average annual outperformance of 4.6%.
Sources: Morningstar, TSE Russell 9/30/2015-8/31/2023
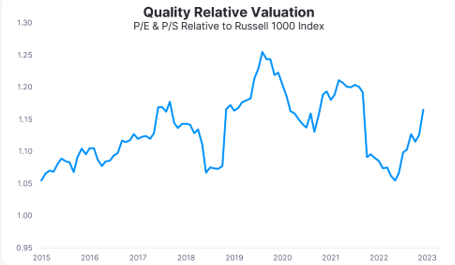
Quality Is Expensive
Quality is naturally expensive, but even more so than the long-term average. Given concerns about potential economic weakness, how can we maintain a quality exposure but be conscious to not overpay? How can investors emphasize a valuation sensitivity to a US quality stock tilt, especially given valuation and concentration concerns in the US quality space. On the concentration point, which is in many high-quality companies, the top seven stocks within the S&P 500 now reflect a record ~30% of the entire index by market cap (as of 10/13/2023). This is up sharply from 20% at the beginning of 2023 and above the high of 29% in 2021.
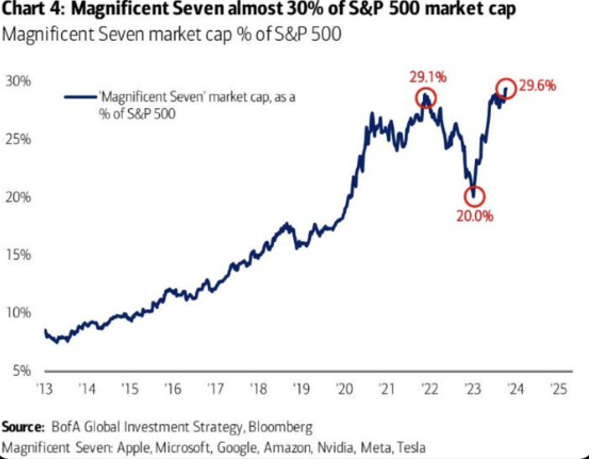
Sources: Chart 4, Magnificent Seven: BoFA Global Investments strategy, Bloomberg
Can an investor find an ETF with the quality exposure, but without the valuation and concentration risk? Who says you can’t have your cake and eat it too? One can get quality a reasonable price. Recently we were researching and analyzing the universe of the top quality tilted/factor ETFs. In the end, our favorite was Xtrackers Russell 1000 US QARP ETF, ticker QARP!
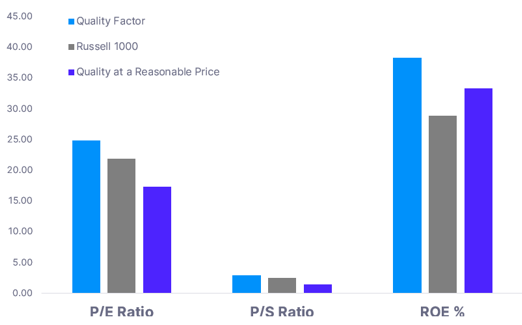
While most of the quality factor ETFs we researched had a growth tilt, a key data point is that QARP (Quality at a Reasonable Price) has a slight value tilt to it. In this environment, we find this attractive. Valuation-wise, QARP is trading at nearly a 20% discount to the Russell 1000, while some of the larger quality factor ETFs are all trading at valuation premiums. Growth metrics wise, comparing QARP again to some of the larger quality factor ETFs, QARP had only slightly lower growth and quality characteristics in aggregate. In other words, while there was a slight give up in quality and growth, the improvement in valuation was significant. The kicker is that comparing QARP to the Russell 1000, QARP has more attractive valuation metrics, with competitive growth metrics!
Source: Morningstar Direct
QARP provides another buffer of diversification to portfolios compared to other quality factor ETFs; QARP has a larger and less concentrated underlying portfolio. Risk and downside protection are also metrics we keep in mind when comparing ETFs; QARP historically so far has had a higher Sharpe Ratio and held up better on the max drawdown statistic versus other large quality ETFs.
Finally, a fun finding I thought I’d add is that QARP has a 60% overlap to Warren Buffett’s Berkshire Hathaway’s stock holdings (of course a large amount of it is AAPL), but for a fellow investment manager based in Omaha, that was a fun finding!
3066-BCI-11/9/2023
Orion Portfolio Solutions, LLC d/b/a Brinker Capital Investments a registered investment advisor.
This material does not constitute any representation as to the suitability or appropriateness of any security, financial product or instrument. There is no guarantee that investment in any program or strategy discussed herein will be profitable or will not incur loss. This information is prepared for general information only, individual client accounts may vary. It does not have regard to the specific investment objectives, financial situation, and the particular needs of any specific person who may receive this report. Investors should seek financial advice regarding the appropriateness of investing in any security or investment strategy discussed and should under the statements regarding future prospects may not be realized. Investors should note that security values may fluctuate and that each securities price or value may rise or fall. Accordingly, investors may receive back less than originally invested. Past performance is not a guide to future performance, investing in any security involves certain non-diversifiable risks including, but not limited to, market risk, interest-rate risk, inflation risk, and event risk. These risk are in addition to any specific, or diversifiable, risks associated with particular investment styles or strategies.
The Russell 1000 index measures the performance of the large-cap segment of the U.S. equity universe. It is a subset of the Russell 3000 index and includes approximately 1000 of the largest securities based on a combination of their market cap and current index membership. An index is an unmanaged group of stocks considered to be representative of different segments of the stock market in general. You cannot invest directly in an index.
The S&P 500 Index is an unmanaged composite of 500-large capitalization companies. This index is widely used by professional investors as a performance benchmark for large-cap stocks. An index is an unmanaged group of stocks considered to be representative of different segments of the stock market in general. You cannot invest directly in an index.
For more news, information, and analysis, visit the ETF Strategist Channel.
