

By Dan Zolet, CFA
SUMMARY
- Equity and bond markets shook off a slow start to finish Q4 -and 2023 – strong.
- Expectations for declining interest rates drove strength in both asset classes.
- International stocks generally had positive returns but lagged US stocks.
Quarterly Recap: On the Back of Rate Expectations and Declining Bond Yields, Equities Shook off a Poor Third Quarter to Finish 2023 Strong
The fourth quarter of 2023 was like a mirror image of the third quarter. Continuing the downtrend that began in Q3, equity markets stumbled out of the gates to start Q4. However, equity markets then turned on a dime and rallied powerfully to end the year. Adding to this poetic symmetry, the Federal Reserve and its’ expected rate policy was the underlying driver of both turnarounds. While fears of ‘higher for longer’ had suppressed stock valuations and led to higher interest rates in the early fall, sudden hopes for multiple rate cuts over the next year spurred on the rally in equities and in bonds.
With the potential tailwind of an easing Fed, credit spreads tightened in the fourth quarter. This led to positive returns in the three major fixed income classes, with more credit-sensitive bonds performing the best.
Returns Recap: Stock Markets Lead the Way, but Bond Markets Rally as Well
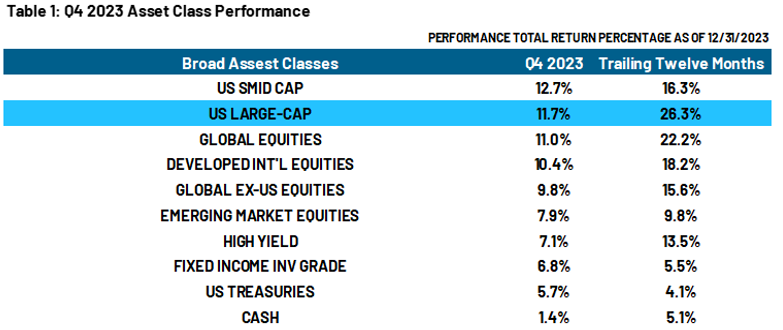
Source: Factset, Morningstar. Data as of December 31, 2023. Chart shown for illustrative purposes only. Past performance is no guarantee of future results. Not indicative of RiverFront portfolio performance. See disclosures at the end of this publication for description of asset classes and the indices for which the returns above are based. Returns above do not reflect any fees or costs associated with investing in the applicable asset classes. It is not possible to invest directly in an index.
US Sectors: Technology Rallies, Energy Lags
With lower rates easing the pressure on valuations, Technology stocks were the strongest performing of the traditional ‘growth’ sectors, while Consumer Discretionary and Communication Services posted returns closer to the market average. As you can see from Table 2 at the top of the next page, ‘value’ sectors saw an even greater dispersion. Industrials and Financials rallied above market average, with strong economic data and falling interest rates providing a tailwind to their respective business models. On the other hand, the Energy sector experienced a negative return quarter, as commodity prices fell sharply this quarter due to worries of oversupply. Real Estate led all sectors in Q4. In our view, this rally was driven by a combination of cheaper financing and low valuations in the sector to start the quarter.
Looking at calendar year 2023, the market’s strength was driven to a large extent by growth sectors rebounding after a difficult 2022. Technology and Communication Services more than doubled the market return over the trailing twelve months, and Consumer Discretionary followed closely behind.
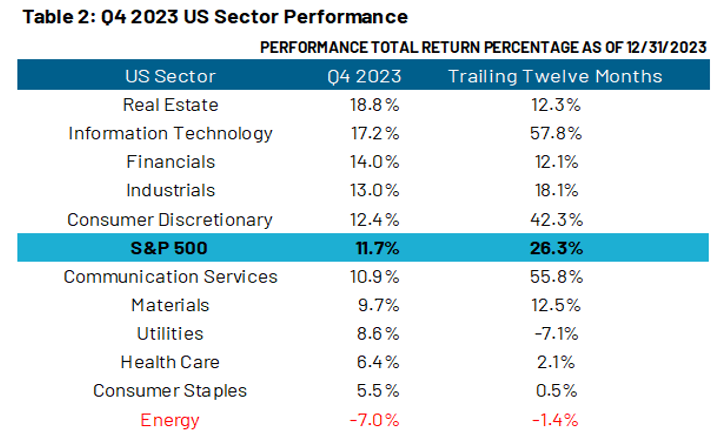
Source: Bloomberg. Data as of December 31, 2023. Chart left shown for illustrative purposes only. Past performance is no guarantee of future results. Not indicative of RiverFront portfolio performance. Returns above do not reflect any fees or costs associated with investing in the listed sectors. the applicable asset classes. It is not possible to invest directly in an index.
International Stocks: Developed Markets Still Lead Over Emerging Ones
International markets trailed US markets in the fourth quarter but were generally able to post positive returns (see Table 3 below). Developed international markets, led by Canada and Europe, were within 1% of S&P 500 returns. This strength was driven by both strong equity and currency returns relative to the US dollar. On the other hand, Emerging markets underperformed most developed markets. This underperformance can be mainly attributed to continued poor returns from Chinese equities, a theme that persisted throughout the year.
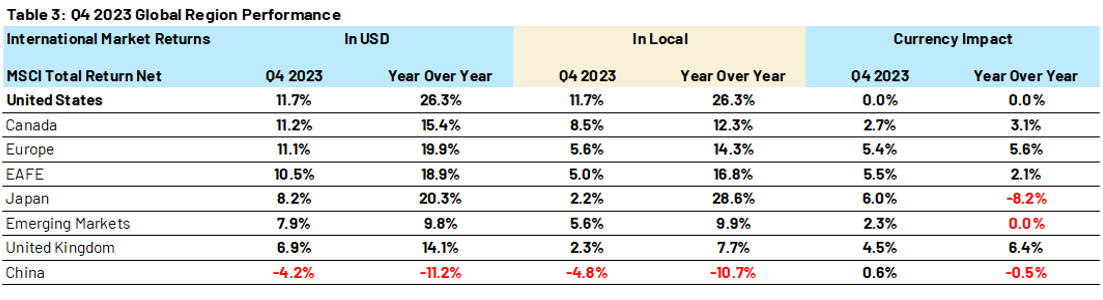
Source: Bloomberg. Data as of December 31, 2023. Chart shown for illustrative purposes only. Past performance is no guarantee of future results. Not indicative of RiverFront portfolio performance. Returns above do not reflect any fees or costs associated with investing in the listed sectors. the applicable asset classes. It is not possible to invest directly in an index.
Looking Forward: We are Cautiously Optimistic for ’24
In Q4 2023, equity markets were able to reestablish the positive trends begun in the first half of the year. We remain cautiously optimistic on stocks, as laid out in our 2024 Outlook. Just as in 2023, the Federal Reserve and their fight against inflation will take center stage, in our view.
In our highest probability Base Case, inflation continues to cool (though at an uneven pace), allowing equity markets to moderately continue their uptrend. In a more optimistic Bull Case scenario, inflation cools at a faster and more consistent pace, allowing the Fed to decisively pivot to an easing policy. On the other hand, our Bear Case outcome would involve the return of high inflation and anemic economic growth, placing the Fed in an impossible position, a catalyst for a stock and bond bear market. However, we place only a 25% chance on this negative outcome, suggesting we believe there is a ~75% chance of positive market returns in 2024.
Given our Base Case involves moderately positive but choppy returns, we believe our ‘P.A.T.T.Y’ theme (‘Pay Attention to the Yield’ – a focus on investments with strong yields and cash flows to support them) would be an effective strategy. Specifically, growth stocks with stable and growing free cash flow, cyclical stocks with well-funded dividends, and alternative yield strategies designed to benefit from market volatility are all long-term themes in our Base case scenario.
From a portfolio construction perspective, we continue to slightly favor stocks over bonds in our balanced portfolios. We currently favor US stocks across our balanced portfolios and are tactically cautious on international.
For more news, information, and analysis, visit the ETF Strategist Channel.
Risk Discussion: All investments in securities, including the strategies discussed above, include a risk of loss of principal (invested amount) and any profits that have not been realized. Markets fluctuate substantially over time, and have experienced increased volatility in recent years due to global and domestic economic events. Performance of any investment is not guaranteed. In a rising interest rate environment, the value of fixed-income securities generally declines. Diversification does not guarantee a profit or protect against a loss. Investments in international and emerging markets securities include exposure to risks such as currency fluctuations, foreign taxes and regulations, and the potential for illiquid markets and political instability. Please see the end of this publication for more disclosures.
Important Disclosure Information:
The comments above refer generally to financial markets and not RiverFront portfolios or any related performance. Opinions expressed are current as of the date shown and are subject to change. Past performance is not indicative of future results and diversification does not ensure a profit or protect against loss. All investments carry some level of risk, including loss of principal. An investment cannot be made directly in an index.
Information or data shown or used in this material was received from sources believed to be reliable, but accuracy is not guaranteed.
This report does not provide recipients with information or advice that is sufficient on which to base an investment decision. This report does not take into account the specific investment objectives, financial situation or need of any particular client and may not be suitable for all types of investors. Recipients should consider the contents of this report as a single factor in making an investment decision. Additional fundamental and other analyses would be required to make an investment decision about any individual security identified in this report.
Chartered Financial Analyst is a professional designation given by the CFA Institute (formerly AIMR) that measures the competence and integrity of financial analysts. Candidates are required to pass three levels of exams covering areas such as accounting, economics, ethics, money management and security analysis. Four years of investment/financial career experience are required before one can become a CFA charterholder. Enrollees in the program must hold a bachelor’s degree.
All charts shown for illustrative purposes only. Technical analysis is based on the study of historical price movements and past trend patterns. There are no assurances that movements or trends can or will be duplicated in the future.
Index Definitions
Standard & Poor’s (S&P) 500 Index TR USD (US Large Cap) measures the performance of 500 large cap stocks, which together represent about 80% of the total US equities market.
Standard & Poor’s (S&P) 1000 Index (US SMID Cap) – the S&P MidCap 400 Index and the S&P SmallCap 600 Index are combined to form the S&P 1000.
MSCI EAFE Index NR USD (Developed International Equities) is designed to represent the performance of large and mid -cap securities across approximately 21 developed markets, including countries in Europe, Australasia and the Far East, excluding the US and Canada. Net total return indices reinvest dividends after the deduction of withholding taxes, using (for international indices) a tax rate applicable to nonresident institutional investors who do not benefit from double-taxation treaties.
MSCI Emerging Markets Index NR USD (Emerging Market Equities) is an equity index that captures large and mid-cap representation across approximately 25 emerging markets (EM) countries.
MSCI Europe Index represents the performance of large and mid-cap equities across approximately 15 developed countries in Europe.
MSCI Japan Index designed to measure the performance of the large and mid cap segments of the Japanese market.
MSCI China Index captures large and mid cap representation across China A shares, H shares, B shares, Red chips, P chips and foreign listings (e.g. ADRs).
MSCI United Kingdom Index (USD) is designed to measure the performance of the large and mid cap segments of the UK market.
MSCI Canada Index is designed to measure the performance of the large and mid cap segments of the Canada market.
The MSCI USA Index is designed to measure the performance of the large and mid cap segments of the US market.
MSCI ACWI Index (Global Equities) is designed to represent performance of the full opportunity set of large- and mid-cap stocks across approximately 23 developed and approximately 25 emerging markets.
MSCI ACWI ex USA Index (Global ex US Equities) captures large and mid cap representation across approximately 22 of 23 developed markets (DM) countries (excluding the US) and approximately 25 emerging markets (EM) countries.
ICE BofA High Yield Index TR USD (High Yield) tracks the performance of US dollar denominated below investment grade rated corporate debt publicly issued in the US domestic market. Index constituents are capitalization-weighted based on their current amount outstanding times the market price plus accrued interest.
Bloomberg Capital US Treasury Index TR USD (Treasury Bonds) measures the performance of the US Treasury bond market.
Bloomberg US Aggregate Bond Index TR USD (Fixed Income Investment Grade) is an unmanaged index that covers the investment grade fixed rate bond market with index components for government and corporate securities, mortgage pass-through securities and asset-backed securities. The issues must be rated investment grade, be publicly traded and meet certain maturity and issue size requirements.
Bloomberg Capital 1–3 Month US Treasury Bill Index TR USD (Cash) includes all publicly issued zero-coupon US Treasury Bills with a remaining maturity between one and three months, are rated investment-grade and have an outstanding face value of $250 million or more.
In a rising interest rate environment, the value of fixed-income securities generally declines.
Stocks represent partial ownership of a corporation. If the corporation does well, its value increases, and investors share in the appreciation. However, if it goes bankrupt, or performs poorly, investors can lose their entire initial investment (i.e., the stock price can go to zero).
Bonds represent a loan made by an investor to a corporation or government. As such, the investor gets a guaranteed interest rate for a specific period of time and expects to get their original investment back at the end of that time period, along with the interest earned. Investment risk is repayment of the principal (amount invested). In the event of a bankruptcy or other corporate disruption, bonds are senior to stocks. Investors should be aware of these differences prior to investing.
High-yield securities (including junk bonds) are subject to greater risk of loss of principal and interest, including default risk, than higher-rated securities.
Buying commodities allows for a source of diversification for those sophisticated persons who wish to add this asset class to their portfolios and who are prepared to assume the risks inherent in the commodities market. Any commodity purchase represents a transaction in a non-income-producing asset and is highly speculative. Therefore, commodities should not represent a significant portion of an individual’s portfolio.
Dividends are not guaranteed and are subject to change or elimination.
Investing in foreign companies poses additional risks since political and economic events unique to a country or region may affect those markets and their issuers. In addition to such general international risks, the portfolio may also be exposed to currency fluctuation risks and emerging markets risks as described further below.
Changes in the value of foreign currencies compared to the U.S. dollar may affect (positively or negatively) the value of the portfolio’s investments. Such currency movements may occur separately from, and/or in response to, events that do not otherwise affect the value of the security in the issuer’s home country. Also, the value of the portfolio may be influenced by currency exchange control regulations. The currencies of emerging market countries may experience significant declines against the U.S. dollar, and devaluation may occur subsequent to investments in these currencies by the portfolio.
Foreign investments, especially investments in emerging markets, can be riskier and more volatile than investments in the U.S. and are considered speculative and subject to heightened risks in addition to the general risks of investing in non-U.S. securities. Also, inflation and rapid fluctuations in inflation rates have had, and may continue to have, negative effects on the economies and securities markets of certain emerging market countries.
Technology and internet-related stocks, especially of smaller, less-seasoned companies, tend to be more volatile than the overall market.
Small-, mid- and micro-cap companies may be hindered as a result of limited resources or less diverse products or services and have therefore historically been more volatile than the stocks of larger, more established companies.
When referring to being “overweight” or “underweight” relative to a market or asset class, RiverFront is referring to our current portfolios’ weightings compared to the composite benchmarks for each portfolio. Asset class weighting discussion refers to our Advantage portfolios. For more information on our other portfolios, please visit www.riverfrontig.com or contact your Financial Advisor.
RiverFront Investment Group, LLC (“RiverFront”), is a registered investment adviser with the Securities and Exchange Commission. Registration as an investment adviser does not imply any level of skill or expertise. Any discussion of specific securities is provided for informational purposes only and should not be deemed as investment advice or a recommendation to buy or sell any individual security mentioned. RiverFront is affiliated with Robert W. Baird & Co. Incorporated (“Baird”), member FINRA/SIPC, from its minority ownership interest in RiverFront. RiverFront is owned primarily by its employees through RiverFront Investment Holding Group, LLC, the holding company for RiverFront. Baird Financial Corporation (BFC) is a minority owner of RiverFront Investment Holding Group, LLC and therefore an indirect owner of RiverFront. BFC is the parent company of Robert W. Baird & Co. Incorporated, a registered broker/dealer and investment adviser.
To review other risks and more information about RiverFront, please visit the website at riverfrontig.com and the Form ADV, Part 2A. Copyright ©2024 RiverFront Investment Group. All Rights Reserved. ID 3327949