

Economic Overview
As long-time Barron’s pundit Randall Forsyth aptly wrote in this weekend’s edition, “Which one of these doesn’t belong? Inflation above target. Solid labor market. Booming stock market. Federal Reserve interest rate cuts.” The obvious answer, Fed interest rate cuts, is also seemingly the one thing supporting risk markets here in 2024. Should Chair Powell and his colleagues decide to postpone policy moves into next year, markets could see unexpected volatility arise.
As for the U.S. consumer and the economy writ large, Goldilocks herself might be envious. The “not too hot, not too cold” metaphor equates to the perfect environment for investors. And, after a decade of paltry bond yields, even fixed income investors can get excited. Whether or not the economy can sustain this equilibrium longer-term is anyone’s guess, but for now, it pays to stay invested.
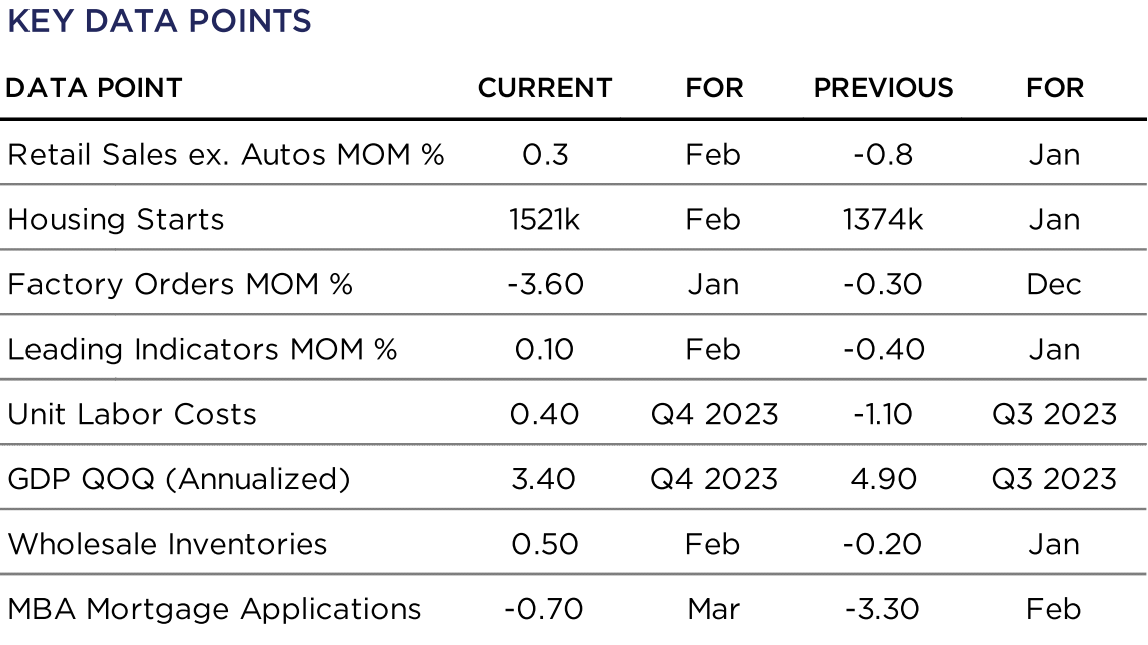
The 3rd reading of 2023 Q4 GDP showed the economy grew at a stronger than expected +3.4% rate, with Personal Consumption up +3.3% and the Core PCE Price Index rising +2.0% QoQ. The Atlanta Fed GDPNow Forecast has the economy slowing to a +2.3% growth rate, which may be a welcome occurrence given the Fed’s current battle against inflation. Unless, of course, it portends Stagflation, which is an increasingly popular topic in the fixed income arena.
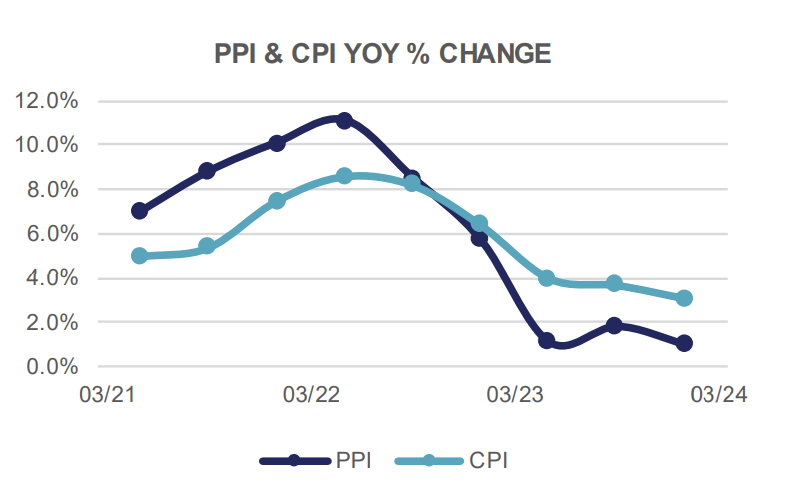
The Fed’s favorite inflation indicator, the Personal Consumption Expenditure index, rose +0.3% in February, and is up +2.5% YoY. The Core PCE also gained +0.3% MoM, and shows ex-food & energy prices are higher by +2.8% YoY. Headline CPI was up a hotter than expected +0.4% MoM in February (+3.2% YoY), while Core CPI was up +0.4% MoM and +3.8% YoY. Producer prices surged +0.6% MoM, but have only risen +1.6% YoY.
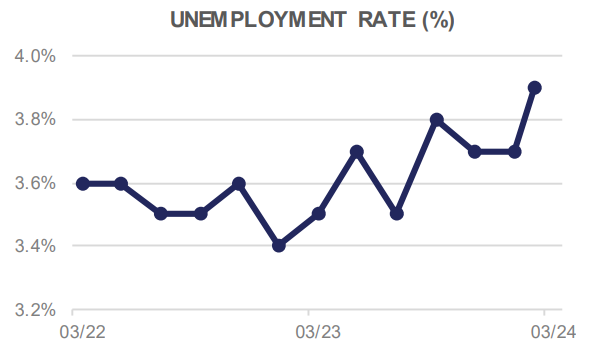
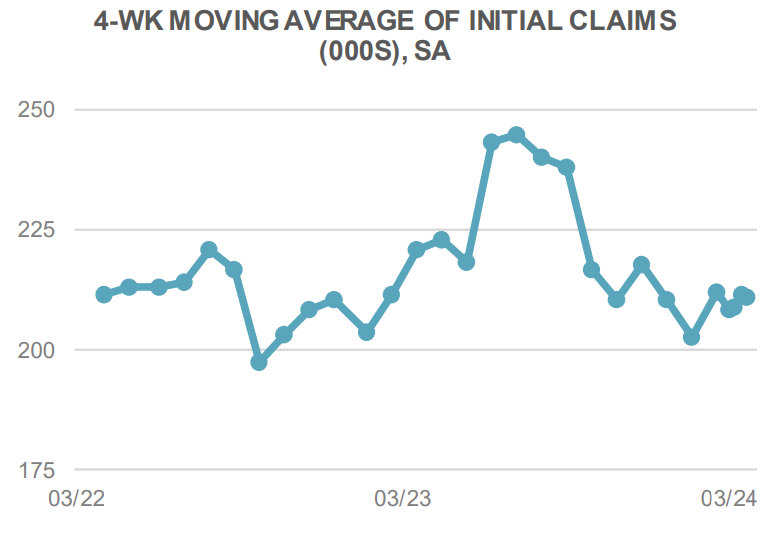
The Employment picture in the U.S remains stable, with the jobless rate coming in at 3.9% in February, higher than expected, although Nonfarm Payrolls increased by a better than forecast +275k. Average Hourly Earnings have risen +4.3% YoY, and the Labor Force Participation rate edged up to 62.5%. Initial Jobless Claims remain consistent around the 210k level.
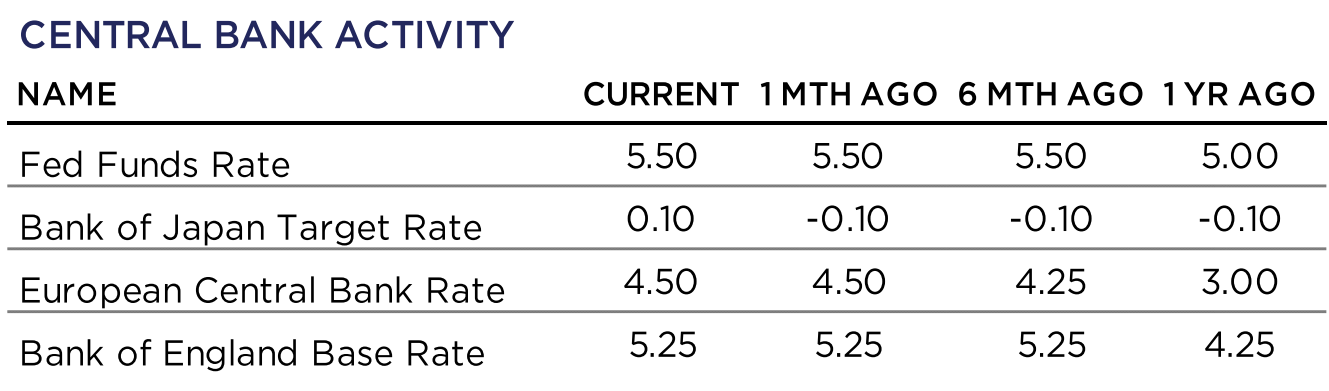
With inflation down considerably from it’s peak, although still above the Fed’s professed target of 2.0%, the FOMC must remain on guard against prematurely cutting interest rates. Markets are slowly embracing this go-slow Fed approach, and expectations are moving towards 3 cuts here in 2024, down from the 5-6 moves anticipated at the start of the year.
Domestic Equity
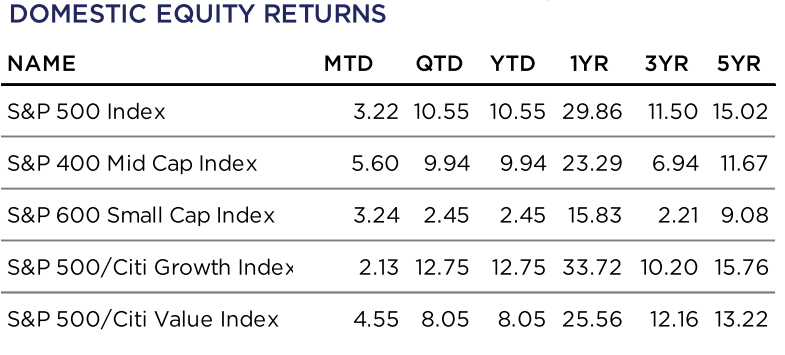
US equities wrapped up the first quarter of 2023 with their hottest start to the year since 2019, as the benchmark S&P 500 index gained +10.6% to start the year. The index added solid performance during the month of March, gaining +3.2%. Since the October 2023 low, the S&P 500 index has rallied +28%, or put differently, has added over $9 trillion in market value, reaching new all-time highs, closing the month at a level of 5,254.
With the S&P equally-weighted index up +7.9% compared to the +10.6% gain in the commonly referenced market cap weighted index, there seems to be hopeful signs that the equity market is broadening out beyond the Magnificent Seven that captivated investors for most of 2023. Following steep pullbacks in Tesla and Apple, the rest of the market remained buoyant. The broadening out of performance was also found in Mid-Cap stocks, as the S&P 400 Mid Cap Index returned +5.6% during the month of March, bringing it’s YTD return to +9.9%.
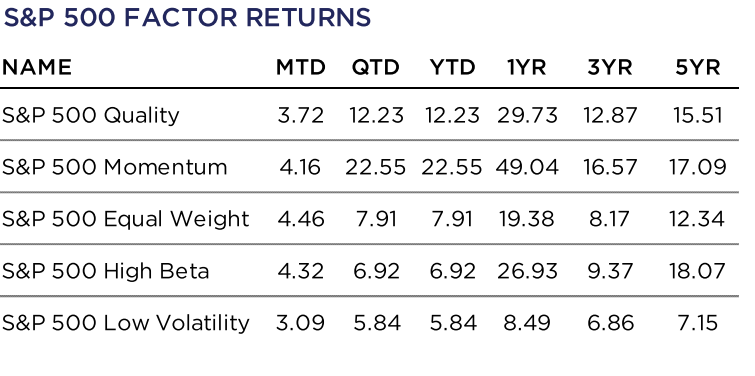
From a factor perspective, Momentum has posted an impressive +22.6% return YTD and a +49.0% 1-year return, highlighting the overall positive inertia seen in the stock market recently. Value finally outperformed growth during the month of March, returning +4.6% compared Growth’s +2.1%. However, the delta of Growth’s outperformance on the year remains significant at +470bps.
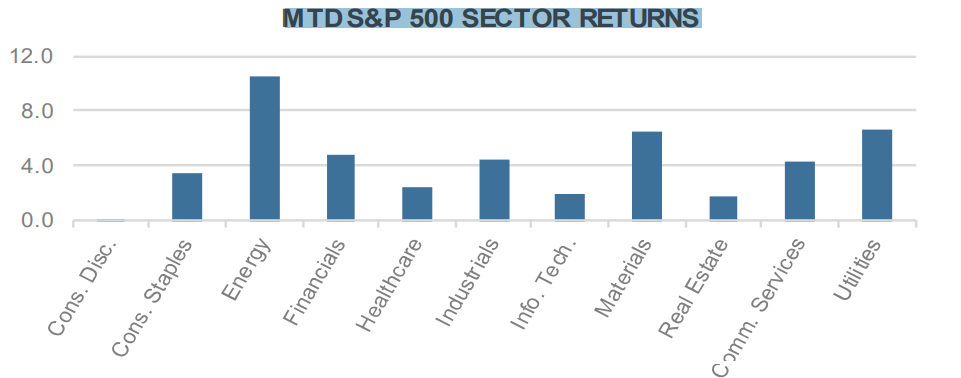
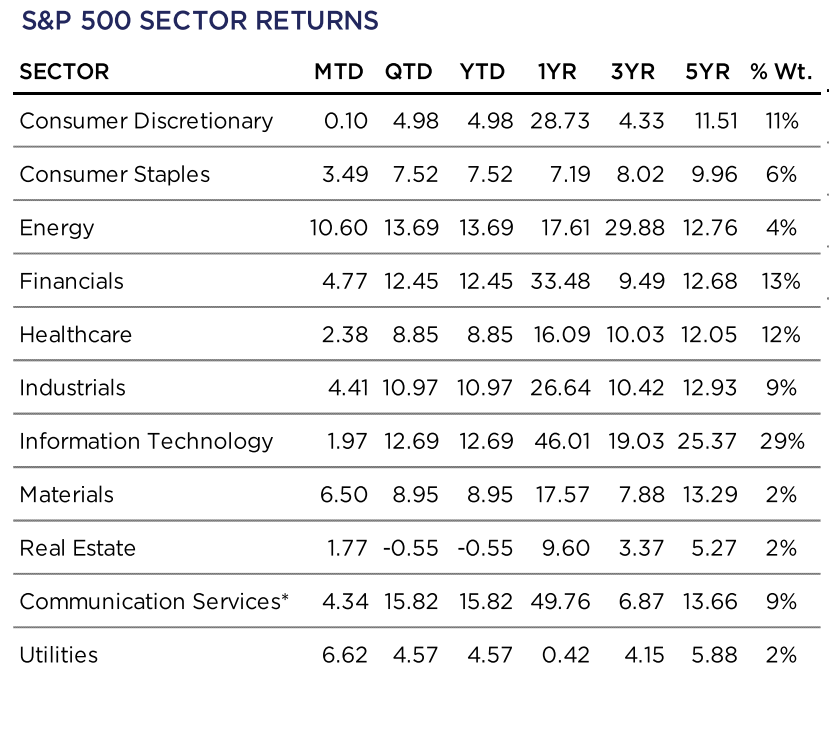
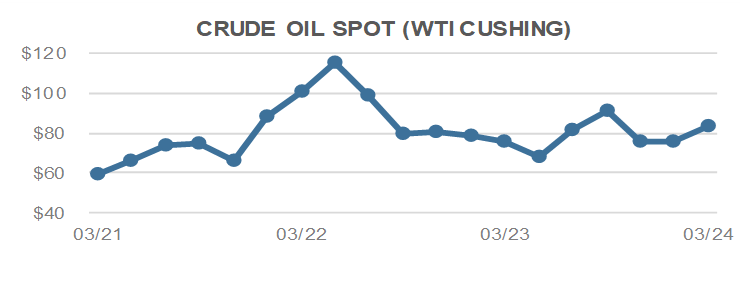
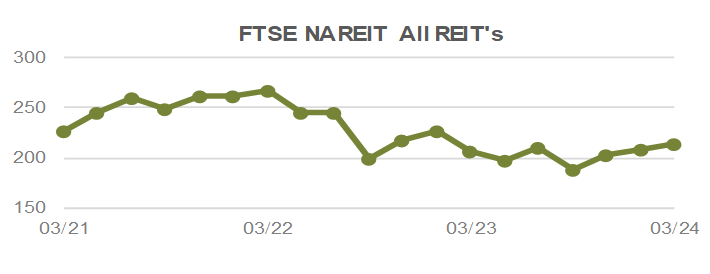
All 11 of the S&P 500 Sectors posted positive returns during the month of March, and all but one (Real Estate) have seen positive returns throughout the first quarter of the year. Energy, driven by rising crude-oil prices, was up +10.6% during the month of March, surpassing all sector returns for the year, except for Communication Services which has posted a +15.8% return to start the year.
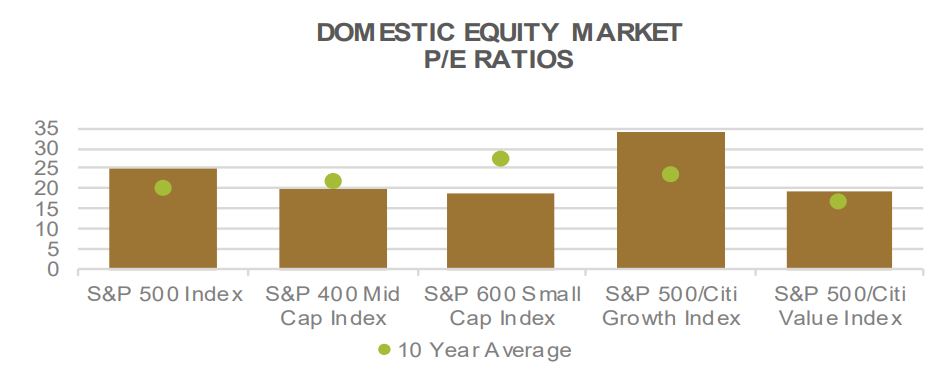
Despite the market’s overly optimistic rate cut expectations and some higher-than expected inflation numbers in the first quarter, the US equity market has moved higher on the backs of expanded P/E multiples, increased earnings expectations and a resilient labor market.
International Equity
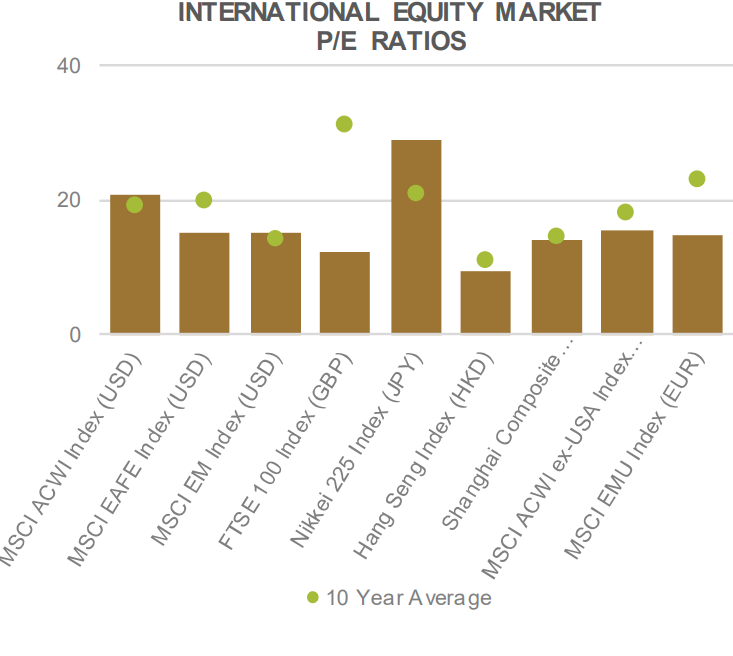
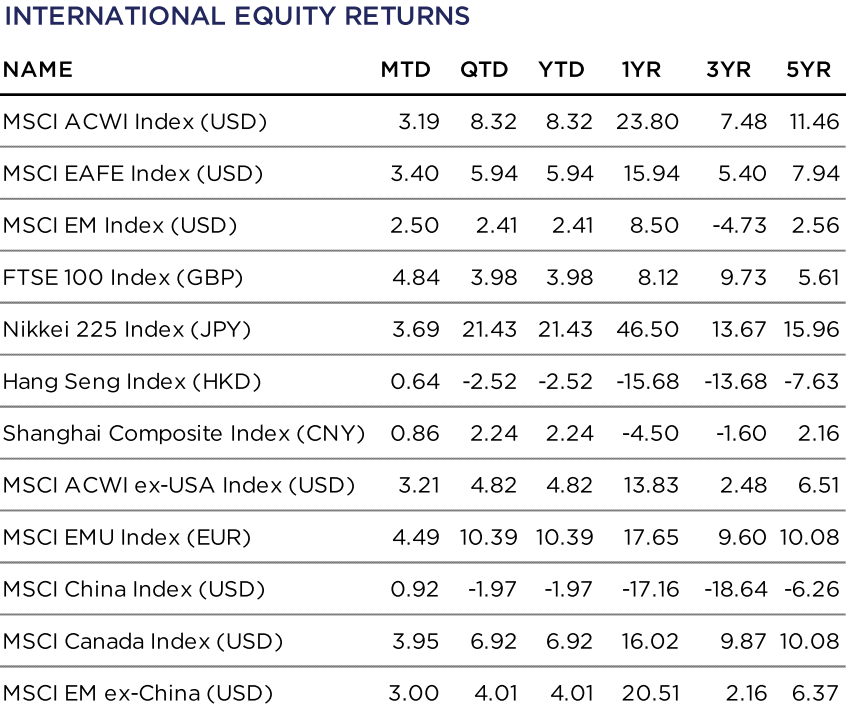
International markets finally found some consistency with most major geographic regions posting positive returns during the month of March. Developed Markets (DM), as measured by the MSCI EAFE Index (USD), posted a +3.4% return on the month. Emerging Markets (EM), as measured by the MSCI EM Index (USD), returned +2.5%. Overall, the risk-on sentiment that was felt in domestic US markets was shared internationally as the MSCI ACWI ex-USA Index (USD) returned +3.2% in March and has now posted a +4.8% return YTD, despite the volatility seen in many major markets.
The MSCI EMU Index (EUR) gained +4.5% in March, its best month since November 2023, and has now posted solid returns of +10.4% YTD. This comes on the news that consumer sentiment has improved in the Eurozone. The European Commission reported at the end of March that consumer confidence had increased to its highest level in two years, perhaps because of the region’s easing energy concerns. According to the report, consumers’ plans for major purchases has remained stable and industry confidence has increased.
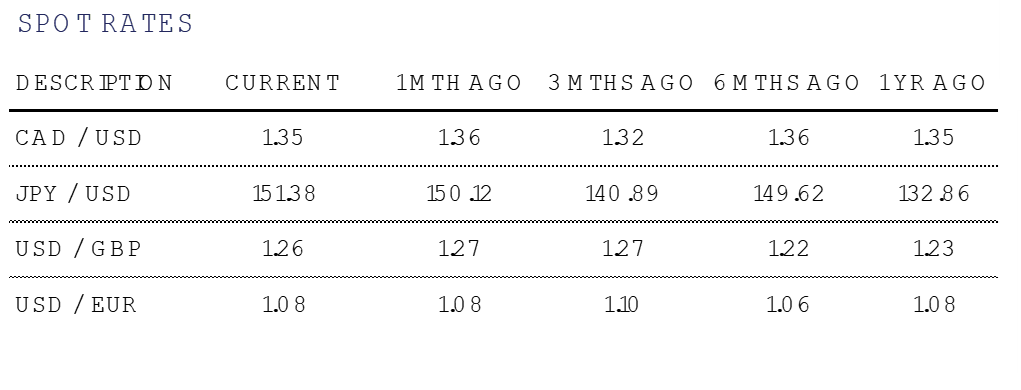
Despite historic weakness in the Yen compared to the US Dollar, Japanese equities posted gains during March, with the Nikkei 225 Index (JPY) returning +3.7% and an impressive +21.4% return YTD. Much of the positive performance found in Japan can be attributed to the numbers of inbound tourism that reportedly have exceeded pre-pandemic levels. Additionally, many of Japan’s large cap exporters have benefitted from increased demand that has picked up given the currency weakness compared to their trading partners. During the last week of the month, many monetary authorities in Japan signaled that they would be ready to intervene in foreign exchange markets to prop up the currency, should continued weakness be found.
In China, mixed economic results continue to leave investors perplexed. Profits at industrial firms grew +10.2% in February compared to one year ago. However, the YoY increase was supported by a low base for comparison from last year when the country began its initial recovery from COVID related lockdowns. Despite the industrial profits, the ongoing property market slump and deflationary pressures felt throughout their economy has many investors proceeding with caution. The MSCI China Index (USD) grew by +0.9% in March but has fallen by -2.0% since the start of the year.
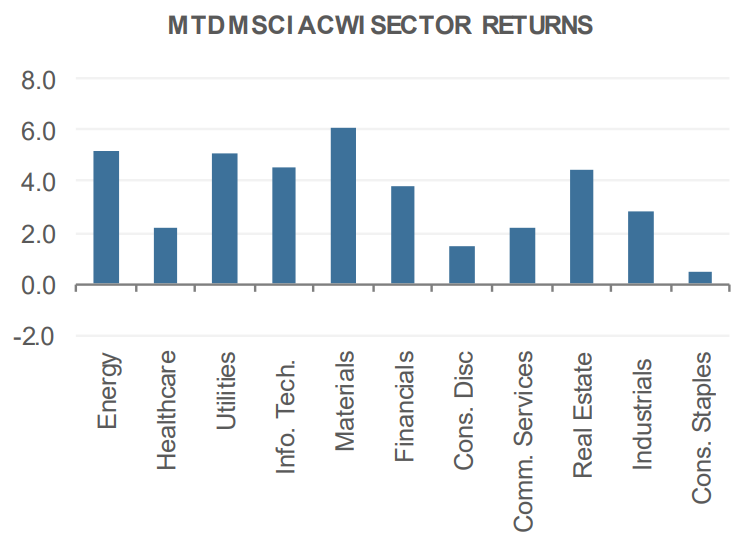
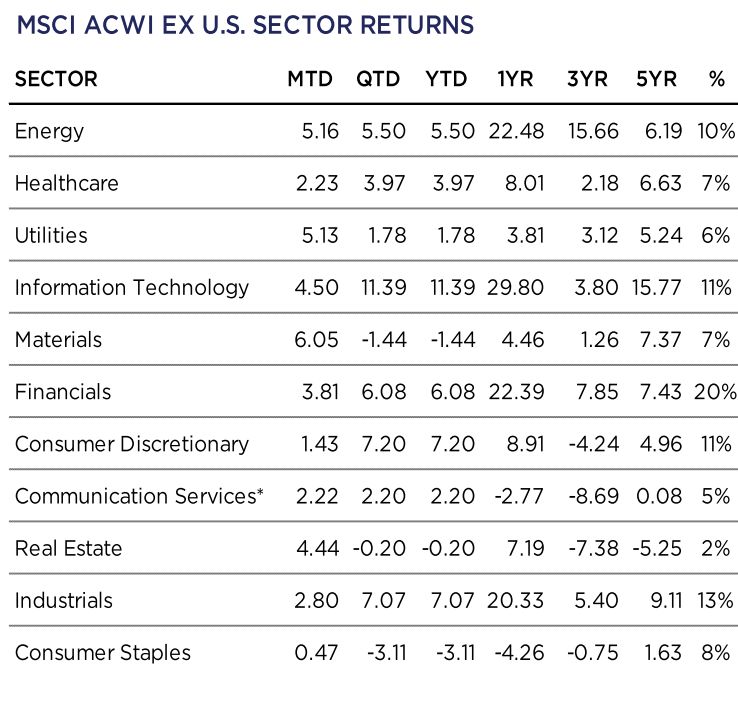
Similar to the domestic US experience, all eleven MSCI ACWI-ex US sectors posted positive returns during the month of March. The sector returns were led by Materials (+6.0%), Energy (+5.2%) and Utilities (+5.2%) while Consumer Staples (+0.5%) and Consumer Discretionary (+1.4%) were the laggards.
Fixed Income
Federal Reserve Chairperson Jerome Powell’s recent commentary has remained dovish, dismissing the less accommodating inflation data that has recently been experienced. Although the Chairperson has been steadfast in his support of the accommodating pivot that has provided fuel for the risk markets, other Fed board members have shared less dovish expectations. Some members have talked down the likelihood of three rates cuts this year, and instead are leaning towards one or none. While the bond market has dialed back its expectation of dramatic rate cuts in 2024, the equity market has continued to push higher.
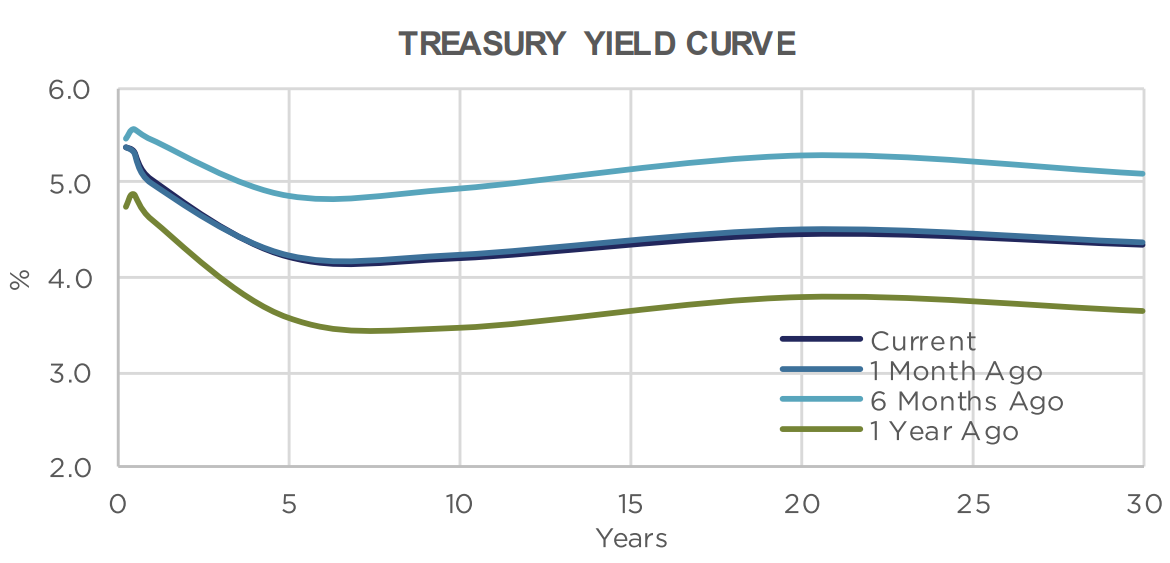
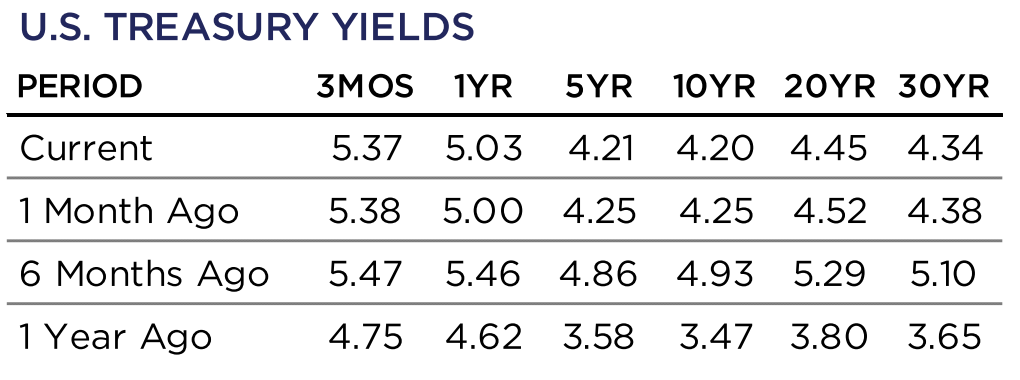
During the past month there was some interest rate volatility, up and down, but at the end of the month it netted out to a yield curve that was roughly flat (~5 basis points lower). This stability allowed the fixed income indices to earn their coupons with little price movement.
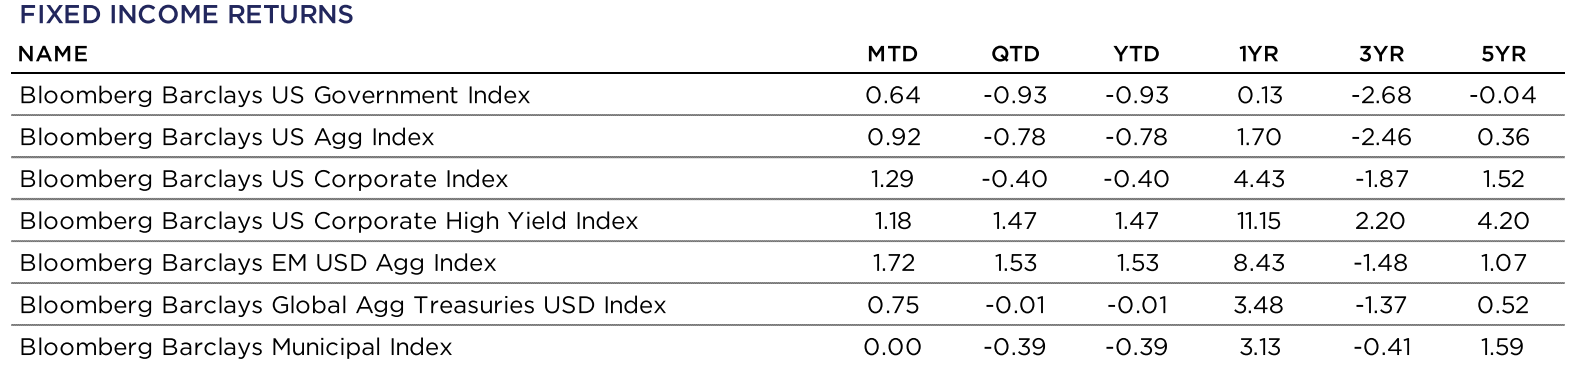
The Government index has a lower yield due to its lack of credit risk. In March, the index produced a return of +0.64% with rates relatively flat.
The Investment Grade (IG) Corporate bond index has some credit risk and pays a higher yield. During the month, Single A credit spreads were stable, and BBB credit spreads contracted slightly (price upside). These effects combined to create a monthly return of +1.29%.
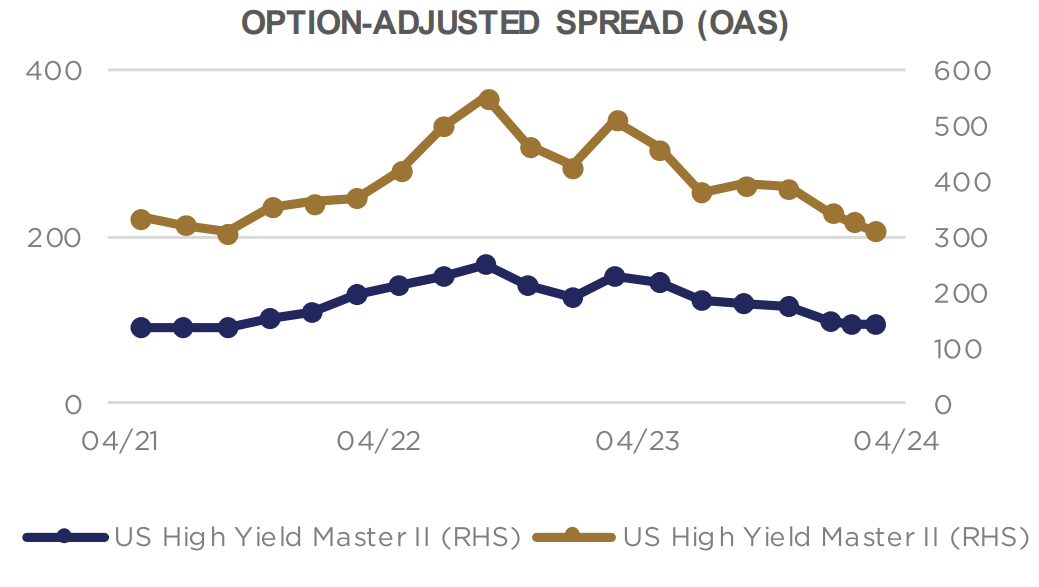
High Yield (HY) Corporate bonds have significantly more credit risk, requiring a higher yield than IG Corporate bonds. High Yield bonds also posted a strong monthly return of 1.18% in March.
Tax-free municipal bonds remain pricey, even after underperforming the other bond indices in March with a flat return. It is important to work with an expert that knows how to search offerings for value. Value can still be found, but does require some work to reveal it. For those in high tax-rates (which may revert higher when the TJCA expires), tax-free bonds remain an attractive allocation. A custom built portfolio is the best solution.
Year-to-date, the top performing allocation has been HY Corporate bonds, followed by IG Corporate bonds. As mainstream allocations have become more expensive, it has become more important to look beyond the most traditional allocations. There may be value to be found in securitized fixed income (CLO/ABS/MBS).
Alternative Investments
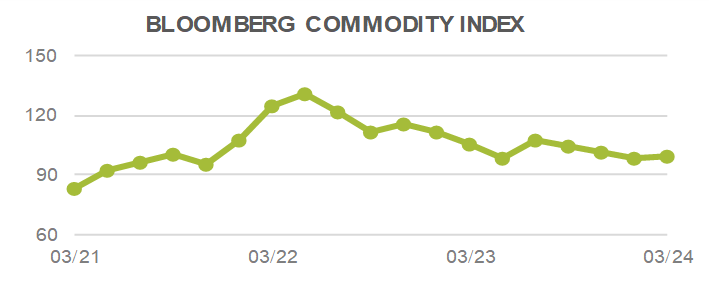
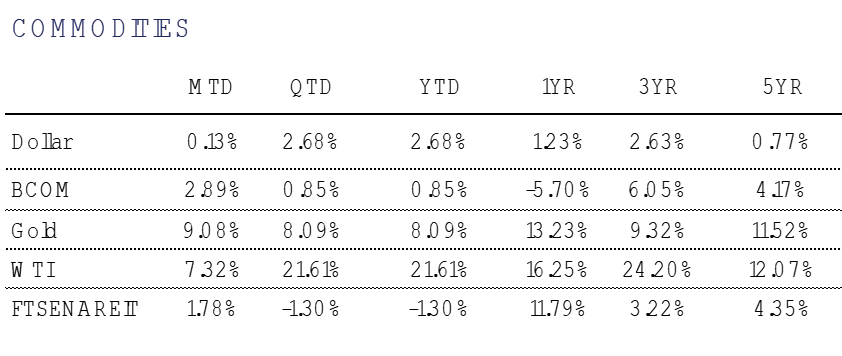
Alternative investments had mainly positive returns in March. Broad Commodities, as measured by the Bloomberg Commodity Index, were up +2.9% on the month.
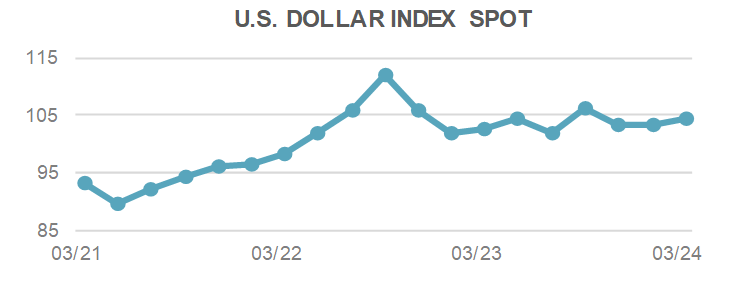
U.S. Dollar strength continued in Q1, with the DXY Index rising +2.7% during the period. The Dollar rose as investors have pared back their expectations on the number of rate cuts by the Fed this year due to a stronger than expected U.S. economy. One interesting currency pair to observe is the Japanese Yen to the U.S. Dollar. The dollar reached its strongest level against the Yen in over 30 years before closing the month at 151.38 JPY/USD. A widening gap between U.S. and Japanese government bond yields has led to the weakening of Japan’s currency. This has occurred despite the Bank of Japan shifting away from an ultra easy monetary policy and introducing a small interest rate hike in March.
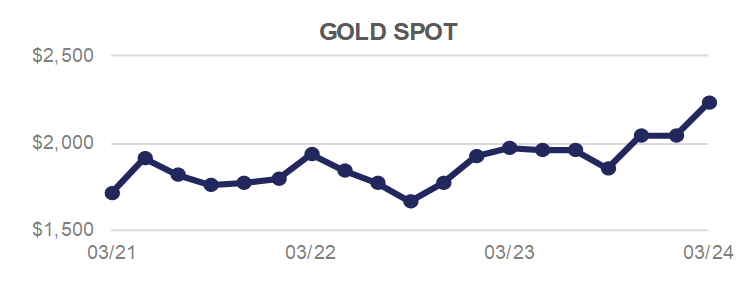
Gold rallied substantially during the month, rising +9.1% in March. The precious metal reached an all-time high of $2,229 intra-month and looks to set another all time high as we go to press. As mentioned in previous market wraps, gold can be useful as a portfolio diversifier as it moves in an uncorrelated way relative to equities and fixed income.
Although gold is traditionally viewed as an inflation hedge, its recent rally may have been driven by uncertainty around the global economy due to geopolitical tensions and political polarization. The commodity can be an alternative store of value that isn’t contingent on any given government or corporation. Central banks and Chinese investors have also been increasing their net purchases, pushing up demand and supporting the price.

For more news, information, and strategy, visit the ETF Strategist Channel.