
Markets Rally in November
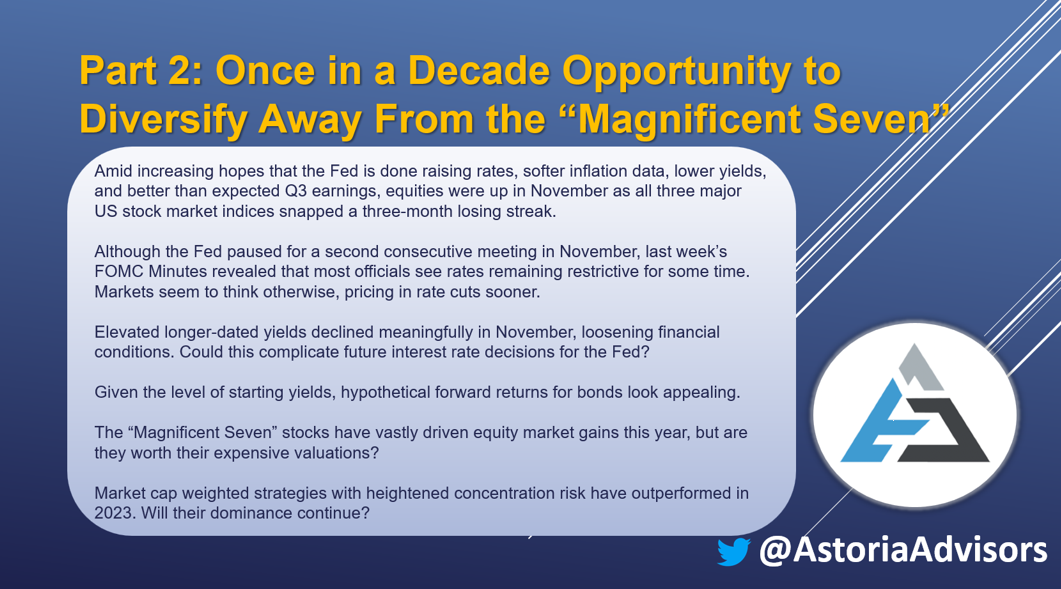
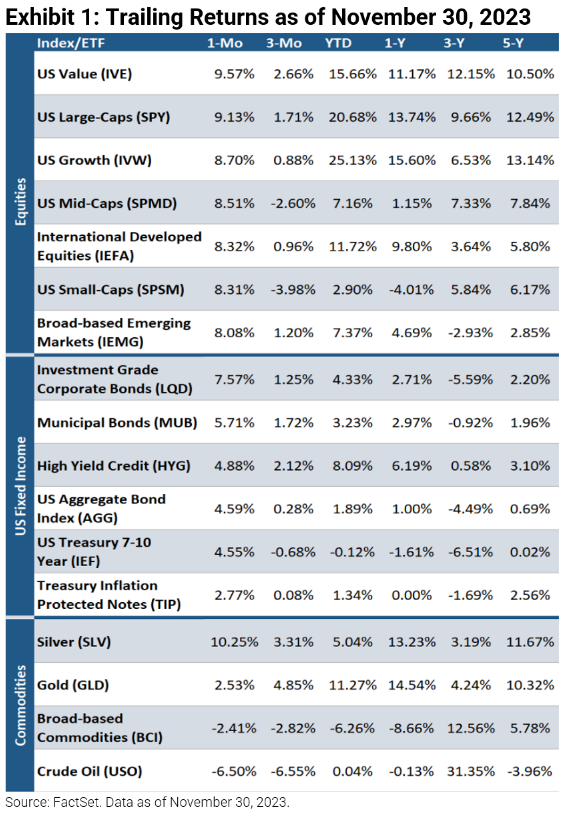
Amid increasing hopes that the Fed is done raising rates, softer inflation data, lower yields, and better than expected Q3 earnings, equities were up in November as all three major US stock market indices snapped a three-month losing streak. The Nasdaq Composite was up 10.8% while the S&P 500 gained 9.1%, both posting their best month since July 2022. The Dow Jones Industrial Average also increased 9.2%, notching its best month since October 2022. US value (+9.6%) was among the best performers, followed by US large-caps (+9.1%) and US growth (+8.7%). Bonds were also up as investment grade corporates rose 7.6%, municipal bonds gained 5.7%, and high yield credits increased 4.9%. Commodities produced mixed returns as silver (+10.3%) and gold (+2.5%) were up while crude oil (-6.5%) and broad-based commodities were down (-2.4%).
Fed Pauses But Doesn’t Rule Out Future Hikes
The Federal Reserve kept interest rates unchanged at the November FOMC meeting, leaving the fed funds rate at the 5.25–5.50% range. Although the central bank paused for a second consecutive meeting, Fed Chairman Jerome Powell stated, “The process of getting inflation sustainably down to 2% has a long way to go.” He also expressed that the full effects of restrictive monetary policy have not yet materialized, and the committee didn’t rule out future rate hikes. On a more positive note, Powell acknowledged that wage increases have come down, and that the risks of tightening too much or too little have become more balanced. Last week’s FOMC Minutes revealed that most officials see rates remaining restrictive for some time, echoing the Fed’s higher for longer messaging. However, on the back of softer October inflation prints, markets seem to be pricing in rate cuts sooner as stocks have rallied with longer-dated yields simultaneously falling from recent highs. Fed funds futures now signal up to five 25bps rate cuts in 2024, with the first occurring as early as May.
Financial Conditions Loosen
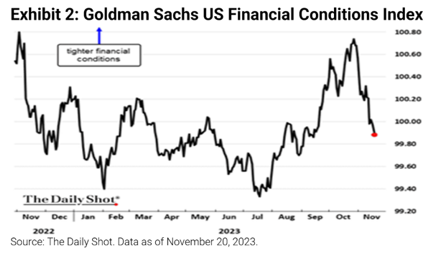
Speculating lower interest rates ahead, investors rushed in to buy bonds, pushing down the yield on the 10-year US Treasury from 4.90% on October 31st to 4.36% on November 30th. As a result, US financial conditions as per Goldman Sachs’ index have loosened significantly. As elevated longer-dated yields were aiding the works of restrictive monetary policy, could their decline complicate future interest rate decisions for the Fed?
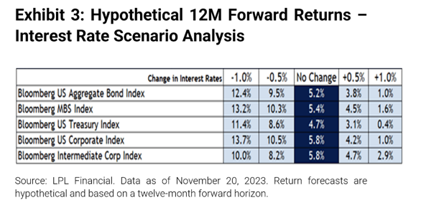
Forward Bond Returns Look Attractive
Given the level of starting yields, hypothetical forward returns for bonds look appealing (bond prices & interest rates are inversely related). LPL Financial forecasts that just a 50bps decrease in interest rates would cause the Bloomberg US Treasury Index to gain over 8% in the next 12 months. As the bond indices in Exhibit 3 are high in quality, some may refer to this as a possibility to earn equity-like returns without equity-like risks.
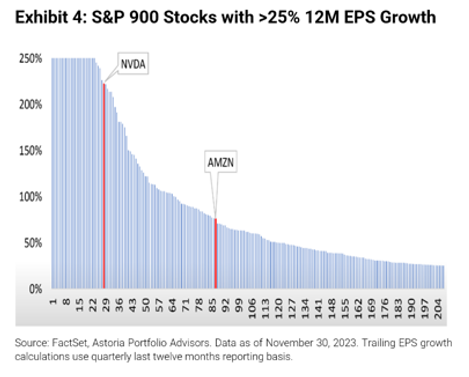
How Magnificent are the Seven Stocks?
In our September commentary, we wrote that there was a once in a lifetime opportunity to diversify away from the “Magnificent Seven.” These stocks have vastly driven equity market gains this year, but are they worth their expensive valuations? When analyzing 900 constituents in the S&P 900 Index, 207 companies saw earnings growth greater than 25% over the last twelve months. More interestingly, only two of the “Magnificent Seven” stocks (NVDA & AMZN) make that list. In the event of a soft landing and a continued earnings recovery, this suggests that there may be more attractive opportunities across other cheaply valued stocks with appealing growth potential.
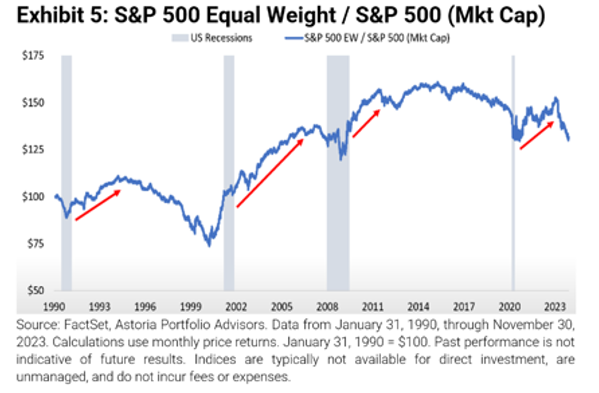
Will Market Cap Dominance Continue?
Currently, market cap weighted strategies pose heightened concentration risk, with the top seven companies in the S&P 500 Index making up almost 30%. Though such a weighting methodology has outperformed in 2023, history implies that this approach may not continue to in the future. As seen below, the S&P 500 Equal Weight Index has historically outperformed the S&P 500 Index, which is market cap weighted, when the economy comes out of a recession as market breadth increases on the back of improved economic conditions.
Which Indicators are we Monitoring for a Recession or Recovery?
1) Un-inversion of US Treasury Yield Curve: When the spread between the 2-year and 10-year Treasury yield turns positive after it has inverted, it has historically signaled a recession is close.
2) Leading economic indicators troughing: The Conference Board Leading Economic Index has declined for 19 straight months; longest since GFC.
3) Profits recovery: Q3 S&P 500 earnings growth was positive; the prior three quarters saw declines.
4) ISM Manufacturing/Services PMIs steady in expansionary territory (above 50): Manufacturing is at 46.7; services is at 51.8 but trending down.
5) Improvement in credit/lending standards: These are likely to stay tight as long as rates are elevated.
6) Increasing market breadth: The S&P 500 continues to outperform the S&P 500 Equal Weight.
7) Reset in valuations: Further decreases could create buying opportunities.
Warranties & Disclaimers
There are no warranties implied. Past performance is not indicative of future results. Information presented herein is for educational purposes only and does not intend to make an offer or solicitation for the sale or purchase of any specific securities, investments, or investment strategies. Investments involve risk and, unless otherwise stated, are not guaranteed. The returns in this report are based on data from frequently used indices and ETFs. This information contained herein has been prepared by Astoria Portfolio Advisors LLC on the basis of publicly available information, internally developed data, and other third-party sources believed to be reliable. Astoria Portfolio Advisors LLC has not sought to independently verify information obtained from public and third-party sources and makes no representations or warranties as to the accuracy, completeness, or reliability of such information. Astoria Portfolio Advisors LLC is a registered investment adviser located in New York. Astoria Portfolio Advisors LLC may only transact business in those states in which it is registered or qualifies for an exemption or exclusion from registration requirements.
For more news, information, and analysis, visit the ETF Strategist Channel.