The current economic dispute is whether the economy will have a hard or soft landing. A hard landing means economic recession. A soft landing is the perfect outcome for investors because the economy would slow alleviating the need for higher interest rates, but wouldn’t slow enough to hurt earnings. Many have called the soft landing scenario the “Goldilocks” outcome because the economy would not be too hot nor too cold.
Despite profits growth becoming more abundant, investors generally continue to focus on the so-called Magnificent 7 stocks1. Such narrow leadership seems totally unjustified and their extreme valuations suggest a once-in-a-generation investment opportunity in virtually anything other than those 7 stocks.
Profits cycle has troughed
Over the past 30 years we have consistently emphasized the importance of profits cycles relative to economic cycles because equity markets are more influenced by profits than by overall economic growth.
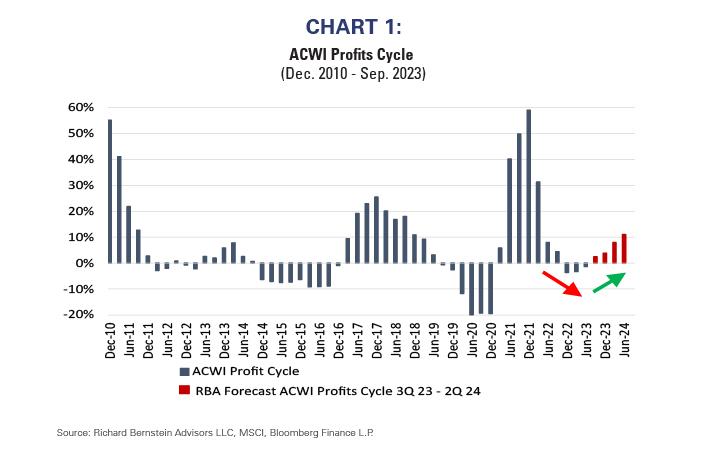
Chart 1 shows our forecast for the global profits cycle through mid-2024. Although global markets experienced a profits recession heading into 2023, it increasingly looks like global profits growth during 2024 will be healthy.
1 Mag 7: Magnificent 7: Alphabet, Nvidia, Tesla, Microsoft, Apple, Amazon, Meta
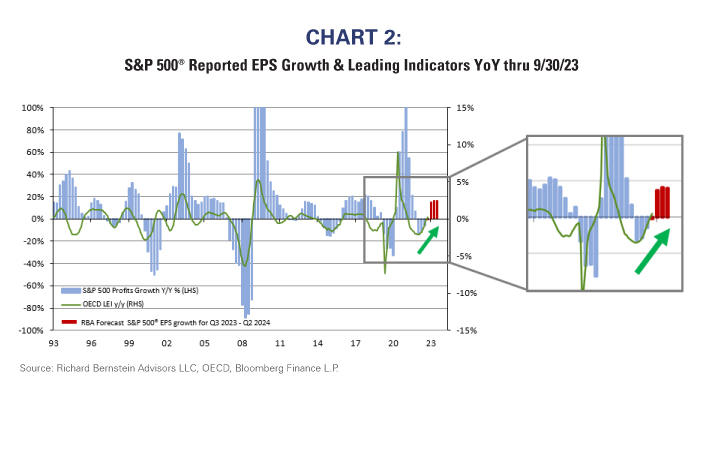
Chart 2 compares the OECD Leading Indicators for the US with the S&P 500® profits cycle. Most important, the leading indicators have troughed, and that goes against the consensus economic landing forecast. Second, the Leading Indicators lead the profits cycle, so an upturn in the leading indicators argues for increasing cyclical exposure. We see S&P 500® earnings growth accelerating to 10-15% during 2024.
Although it may sound ridiculously simplistic, investors always need to remember the profits cycle is always influenced by cyclicals. Stable growth companies are just that, stable, and that inherent stability can’t mathematically cause an up- or down-cycle to occur.
Interest rates rising accordingly
In early July, the consensus forecast for 3Q23 real GDP growth was 0%. The forecast was revised up to 3% by the end of September. The preliminary report was recently announced at 4.9%. In other words, the GDP forecasts were revised upward by 300 bp in a 3-month period, yet were still nearly two full percentage points too low.
Some investors have been surprised by the rapid increase in long-term interest rates, but the rise simply reflects how low growth expectations were going into the 3rd quarter versus the actual strength in the economy.
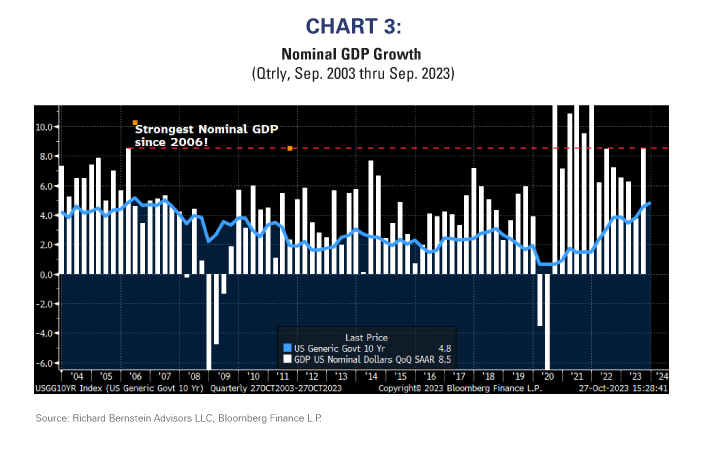
Nominal GDP growth is currently a whopping 8.5%. Chart 3 highlights this quarter’s growth is the strongest since 2006 when one excludes the immediate growth after the pandemic. In 2006, the 10-year yield was 5.1% when nominal GDP growth was similar to today’s. It should not surprise anyone, therefore, that the current 10-year yield is heading for 5%.
Are the Magnificent 7 actually magnificent?
Seven stocks have dominated 2023’s performance in what has been the narrowest market in most investors’ careers. Our research has long showed that narrow markets are economically justified when growth itself is scarce, like during a profits recession, because investors gravitate toward the fewer companies that can produce substantial growth. The extraordinarily narrow leadership of the Magnificent 7 could be justified if growth was extraordinarily scarce.
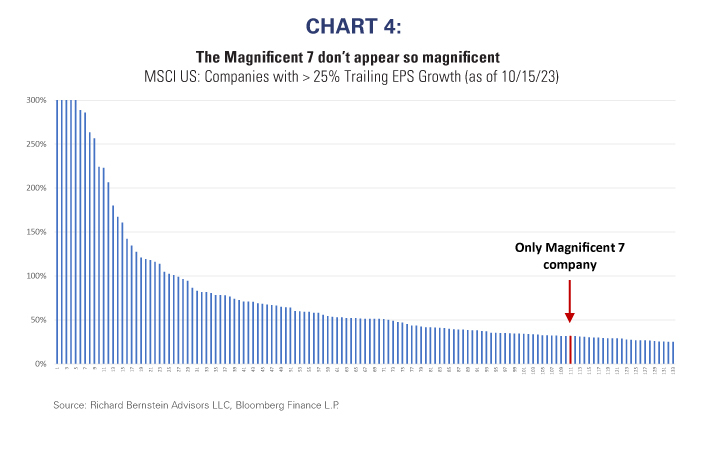
Importantly, growth is not scarce and is actually accelerating. We screened US companies for those with earnings growth of 25% or more. More than 130 companies passed the screen, but only 1 of the Magnificent 7 passed the screen and ranked 111th. Chart 4 suggests there is nothing particularly magnificent about the Magnificent 7.
Magnificent 7 valuations remain extreme
Because growth is starting to accelerate, it makes less and less sense to pay a premium for growth. History suggests that investors become comparison shoppers for growth as it becomes more abundant, so a movement toward the broader and cheaper market seems consistent with history.
Financial theory clearly states valuation always drives long-term returns, and empirical evidence does show that more conservative valuations result in higher returns through time.
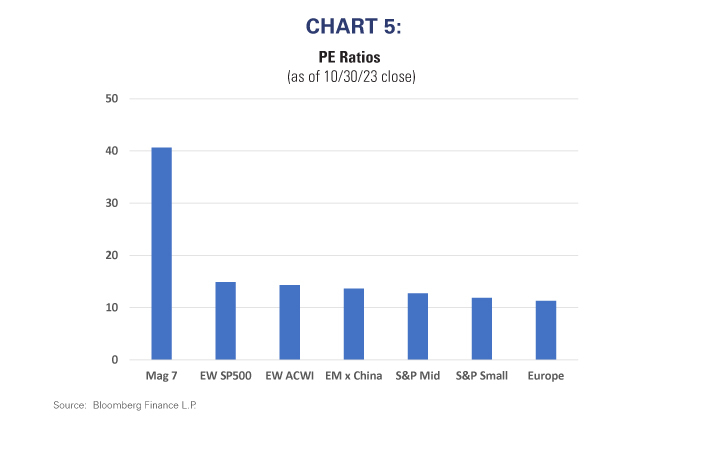
Chart 5 shows the valuation of the Magnificent 7 versus that of the Equal-Weighted S&P 500®, the Equal-Weighted ACWI, the S&P Midcap Index, the MSCI EM ex. China Index, the S&P Smallcap Index, and the MSCI Europe Index.
Virtually the entire global equity market is cheaper than are the Magnificent 7.
The misbalanced seesaw presents a generational opportunity
The profits and economic cycles are stronger-than-expected and broad equity valuations are conservative, yet investors’ portfolios remain overwhelmingly concentrated in the Magnificent 7 stocks. Profits and valuation, when combined with investors’ myopic views on the Magnificent 7 suggest a generational investment opportunity in the broader global equity markets.
Much like after the deflation of the Technology Bubble, investors could be facing another “lost decade in equities”. From 2000-2009, the S&P 500® produced marginal negative returns and technology stocks suffered mightily, but segments such as Energy and Emerging Markets performed very well.
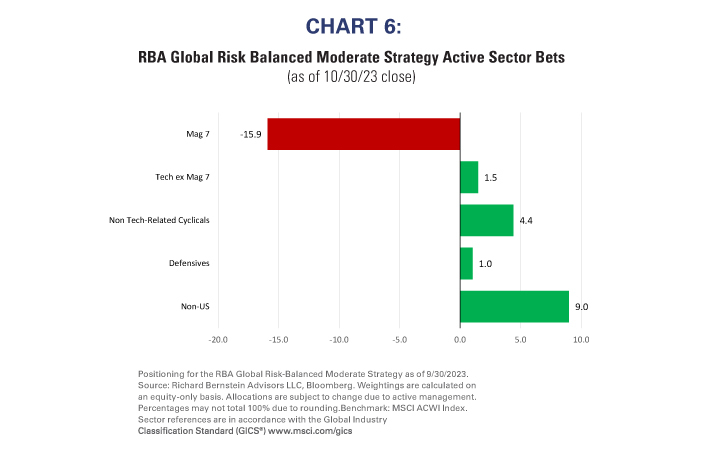
Accordingly, the global equity markets again resemble a seesaw. On one side of the seesaw sit the Magnificent 7, whereas everything else in the global equity markets sits on the other side. Most investors favor the high side of the seesaw with 7 stocks. As Chart 6 shows, our portfolios are squarely positioned on the other side of the seesaw.
For more news, information, and analysis, visit the ETF Strategist Channel.

