

By Chris Konstantinos
SUMMARY
- The US economy is trending stronger than many fear, in our view.
- Recession indicators mixed, but not uniformly negative.
- Any economic turndown is likely to be mild, in our view.
- What’s happening and why,
- Predictions about what may come next,
- Positioning in our RiverFront portfolios.
In today’s Weekly View, we created a concise synopsis of three selected visuals from our October 2023 Chart Pack. In our view, markets could stay volatile and range-bound through year-end, with US investors watching inflation and economic trends closely, as well as the upcoming US presidential election. Nonetheless, as we start to look towards 2024, we have been encouraged by the resilience in the US economy. Our asset allocation portfolios are slightly overweight stocks, with an emphasis on the US. We hope you find the chart pack a helpful tool for client meetings and conversations.
US Economy: Weak Perception VS. Strong Reality
Parts of the US economy are suffering from a lack of confidence about the future, in our opinion. This is evident in data such as low manufacturing sentiment, small business optimism, and consumer confidence.
However, the reality on the ground in the US economy is quite better than the perception and has been for much of the year. US GDP grew in the 2nd quarter, and the Atlanta Fed’s ‘GDPNow’ forecasting tool suggests even higher growth for Q3 (see chart, below).
We believe that the US economy is cooling, but do not foresee the US falling into deep recession in 2023. The situation overseas seems worse, with China flirting with deflation and Germany possibly in a recession.
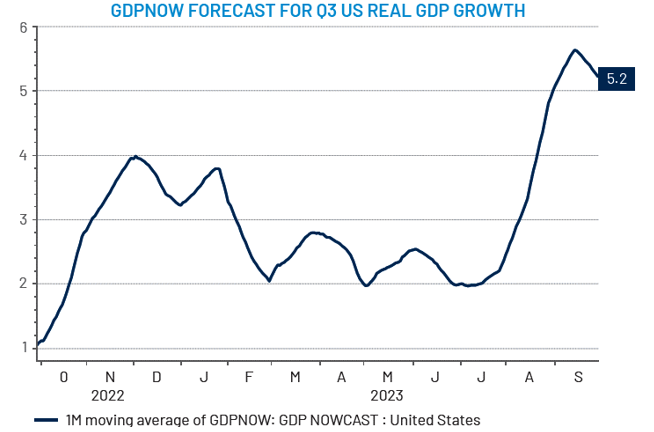
Source: LSEG Datastream, Riverfront. Data daily as of 09.29.2023. Gross domestic product (GDP) is a monetary measure of the market value of all final goods and services produced in a period (quarterly or yearly) of time. The GDP Now nowcast GDP indicator was created by the Atlanta Federal Reserve and combines higher-frequency (e.g., monthly) economic data released before the GDP data to estimate growth in the current quarter.
Recession Watch: Indicators Mixed
Traditional harbingers of recession such as the US 3-month-to-10-year Treasury yield curve and the six- month change in the Leading Economic Index (LEI), have been warning of US recession risks for well over a year now. These reflect subdued sentiment in manufacturing and consumer sentiment, among other things.
However, other important economic indicators, such as credit spreads, employment (chart, right) and services sentiment have stayed robust — suggesting to us a mixed but not recessionary economy.
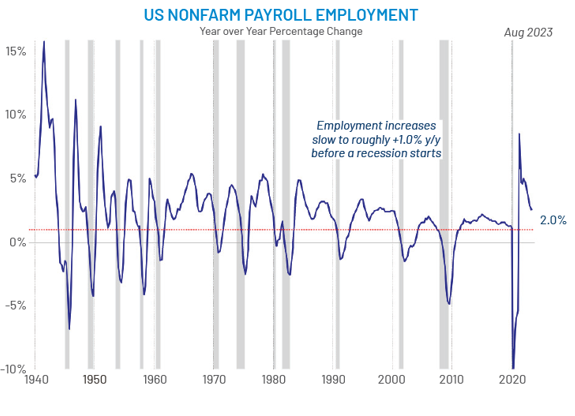
Source: LSEG Datastream, RiverFront; data as of August 2023. Chart right shown for illustrative purposes only. Past performance is no guarantee of future results.
Recession Likely To Be Mild, In Our View
We believe the US will stay out of recession in 2023. However, we also think any future recession should be less severe given that US consumers and corporations are healthier than previous recessions:
- Consumers are in good shape. US consumer debt (including mortgages, auto loans and credit card interest) as a percentage of disposable personal income is significantly lower than before the 2008 housing crisis (see chart, right).
- Consumers also have roughly $2T more in excess savings (or ~9% of GDP) than they did prior to COVID-19, according to The Economist*.
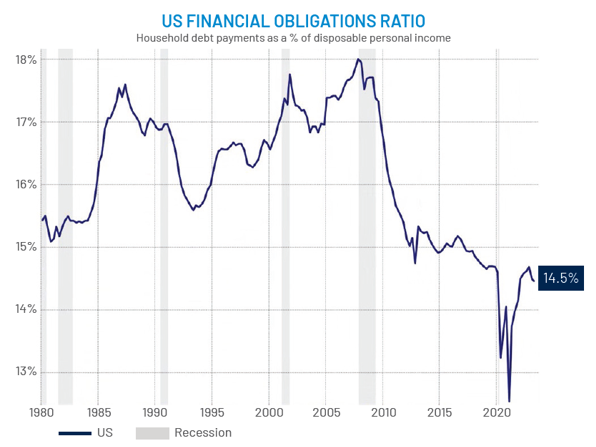
Chart Source: LSEG Datastream, Riverfront; data quarterly as of Q2 2023. Shown for illustrative purposes only. Past performance is no guarantee of future results. *Source: The Economist; What America’s next recession will look like; 06.01.2022, Updated 09.30.2022.
Risk Discussion: All investments in securities, including the strategies discussed above, include a risk of loss of principal (invested amount) and any profits that have not been realized. Markets fluctuate substantially over time, and have experienced increased volatility in recent years due to global and domestic economic events. Performance of any investment is not guaranteed. In a rising interest rate environment, the value of fixed-income securities generally declines. Diversification does not guarantee a profit or protect against a loss. Investments in international and emerging markets securities include exposure to risks such as currency fluctuations, foreign taxes and regulations, and the potential for illiquid markets and political instability. Please see the end of this publication for more disclosures.
Important Disclosure Information:
The comments above refer generally to financial markets and not RiverFront portfolios or any related performance. Opinions expressed are current as of the date shown and are subject to change. Past performance is not indicative of future results and diversification does not ensure a profit or protect against loss. All investments carry some level of risk, including loss of principal. An investment cannot be made directly in an index.
Information or data shown or used in this material was received from sources believed to be reliable, but accuracy is not guaranteed.
This report does not provide recipients with information or advice that is sufficient on which to base an investment decision. This report does not take into account the specific investment objectives, financial situation or need of any particular client and may not be suitable for all types of investors. Recipients should consider the contents of this report as a single factor in making an investment decision. Additional fundamental and other analyses would be required to make an investment decision about any individual security identified in this report.
Chartered Financial Analyst is a professional designation given by the CFA Institute (formerly AIMR) that measures the competence and integrity of financial analysts. Candidates are required to pass three levels of exams covering areas such as accounting, economics, ethics, money management and security analysis. Four years of investment/financial career experience are required before one can become a CFA charterholder. Enrollees in the program must hold a bachelor’s degree.
All charts shown for illustrative purposes only. Technical analysis is based on the study of historical price movements and past trend patterns. There are no assurances that movements or trends can or will be duplicated in the future.
Stocks represent partial ownership of a corporation. If the corporation does well, its value increases, and investors share in the appreciation. However, if it goes bankrupt, or performs poorly, investors can lose their entire initial investment (i.e., the stock price can go to zero). Bonds represent a loan made by an investor to a corporation or government. As such, the investor gets a guaranteed interest rate for a specific period of time and expects to get their original investment back at the end of that time period, along with the interest earned. Investment risk is repayment of the principal (amount invested). In the event of a bankruptcy or other corporate disruption, bonds are senior to stocks. Investors should be aware of these differences prior to investing.
In general, the bond market is volatile, and fixed income securities carry interest rate risk. (As interest rates rise, bond prices usually fall, and vice versa). This effect is usually more pronounced for longer-term securities). Fixed income securities also carry inflation risk, liquidity risk, call risk and credit and default risks for both issuers and counterparties. Lower-quality fixed income securities involve greater risk of default or price changes due to potential changes in the credit quality of the issuer. Foreign investments involve greater risks than U.S. investments, and can decline significantly in response to adverse issuer, political, regulatory, market, and economic risks. Any fixed-income security sold or redeemed prior to maturity may be subject to loss.
Definitions:
Treasury yield is the effective annual interest rate that the U.S. government pays on one of its debt obligations, expressed as a percentage. Put another way, Treasury yield is the annual return investors can expect from holding a U.S. government security with a given maturity.
The Composite Index of Leading Indicators, otherwise known as the Leading Economic Index (LEI), is an index published monthly by The Conference Board. It is used to predict the direction of global economic movements in future months. The index is composed of 10 economic components whose changes tend to precede changes in the overall economy. Businesses and investors can use the index to help plan their activities around the expected performance of the economy and protect themselves from economic downturns.
Gross domestic product (GDP) is a monetary measure of the market value of all final goods and services produced in a period (quarterly or yearly) of time.
The GDP Now nowcast GDP indicator was created by the Atlanta Federal Reserve and combines higher-frequency (e.g., monthly) economic data released before the GDP data to estimate growth in the current quarter.
RiverFront Investment Group, LLC (“RiverFront”), is a registered investment adviser with the Securities and Exchange Commission. Registration as an investment adviser does not imply any level of skill or expertise. Any discussion of specific securities is provided for informational purposes only and should not be deemed as investment advice or a recommendation to buy or sell any individual security mentioned. RiverFront is affiliated with Robert W. Baird & Co. Incorporated (“Baird”), member FINRA/SIPC, from its minority ownership interest in RiverFront. RiverFront is owned primarily by its employees through RiverFront Investment Holding Group, LLC, the holding company for RiverFront. Baird Financial Corporation (BFC) is a minority owner of RiverFront Investment Holding Group, LLC and therefore an indirect owner of RiverFront. BFC is the parent company of Robert W. Baird & Co. Incorporated, a registered broker/dealer and investment adviser.
To review other risks and more information about RiverFront, please visit the website at riverfrontig.com and the Form ADV, Part 2A. Copyright ©2023 RiverFront Investment Group. All Rights Reserved. ID 3171226
For more news, information, and analysis, visit the ETF Strategist Channel.