

Economic Overview
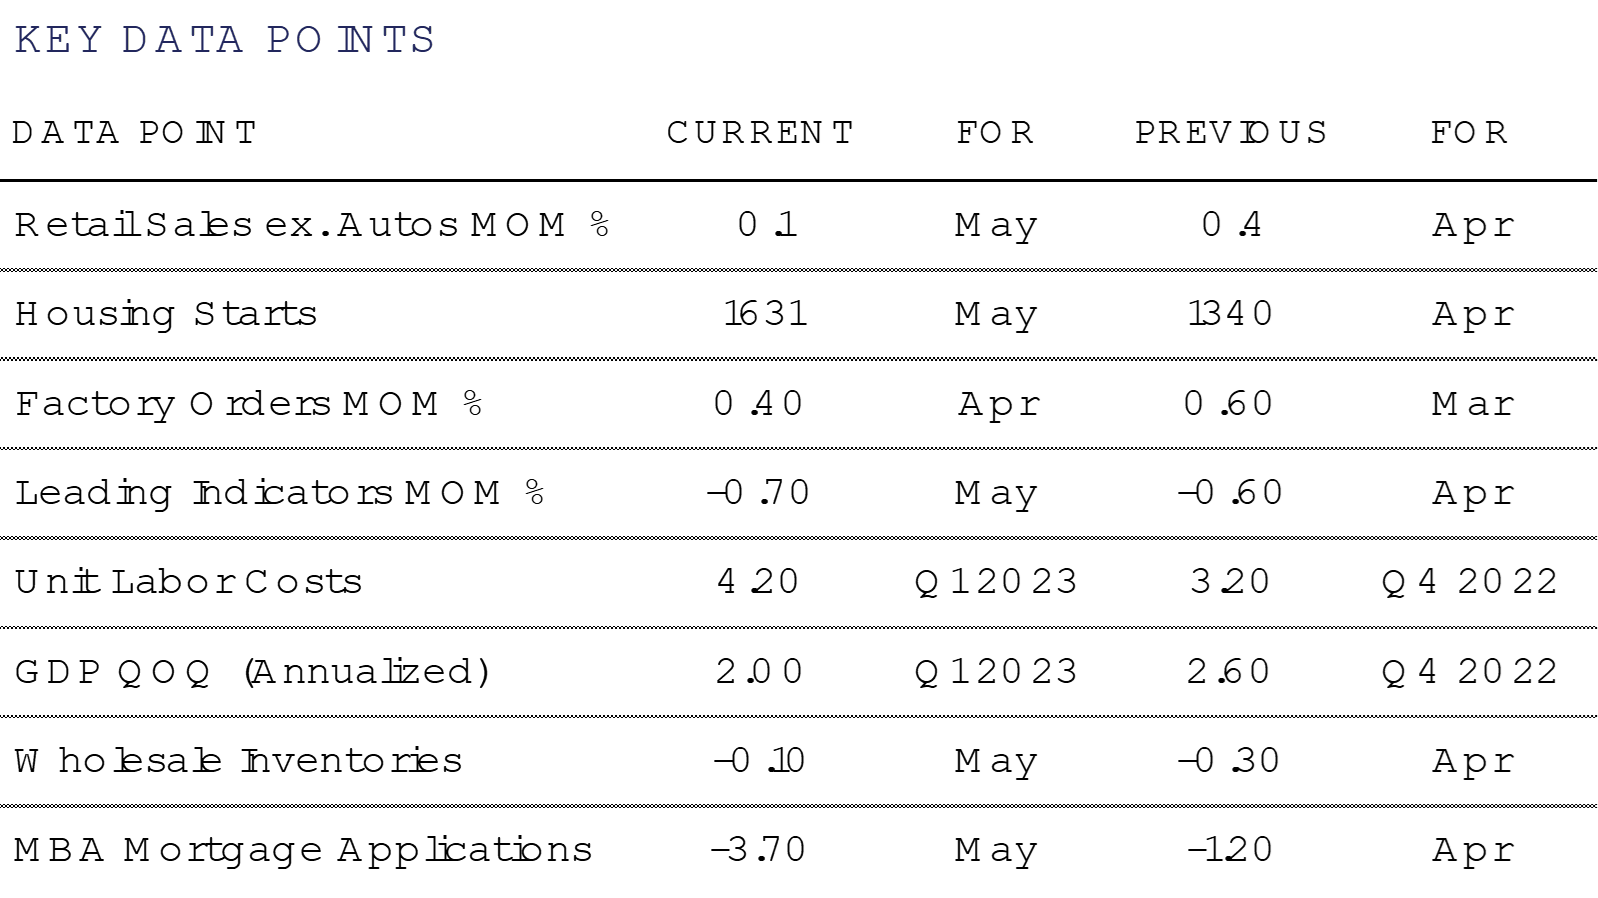
The U.S. economy continued to defy skeptics as well as conventional bond market wisdom concerning the slope of the yield curve. Despite a historically steep inversion, signaling imminent recession, the third reading for Q1 US GDP showed a better than anticipated +2.0% annual growth rate. The only challenge to the “no-landing” thesis may lie in leadings indicators, 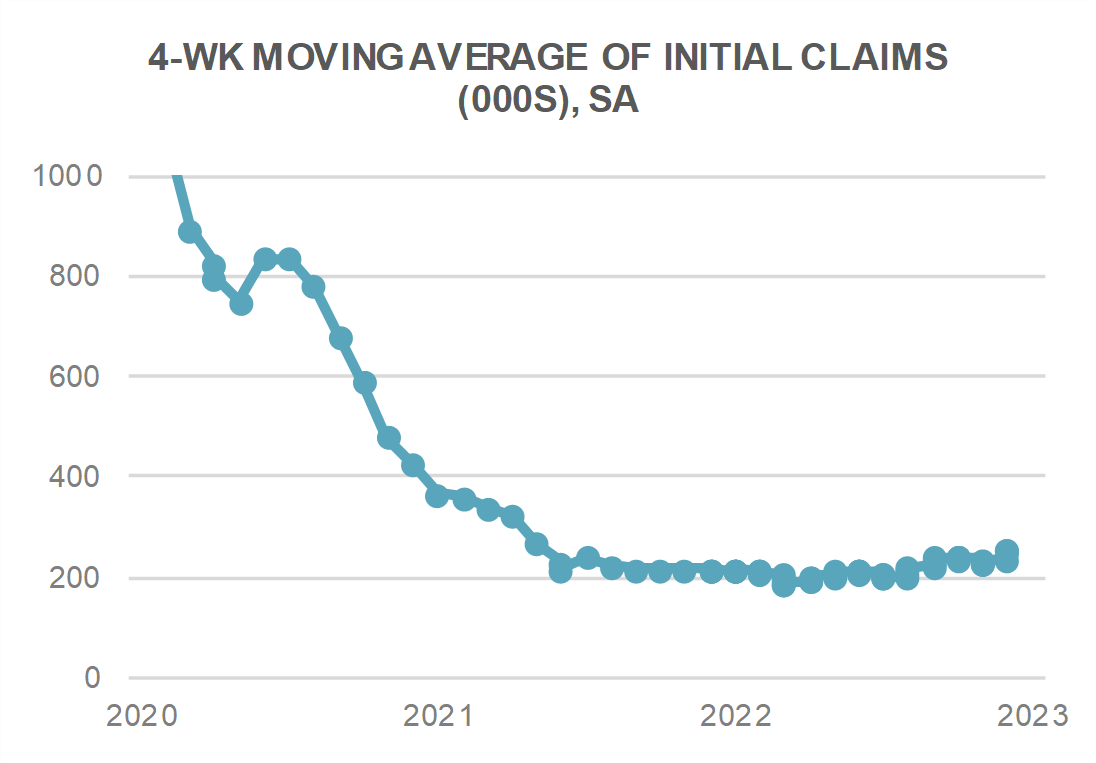 which continue to weaken. The Conference Board’s Leading Economic Index for the U.S. declined by -0.7% in May, the 14th consecutive month of decline. Consumer expectations, new orders indices and worsening credit conditions all contributed to the decline.
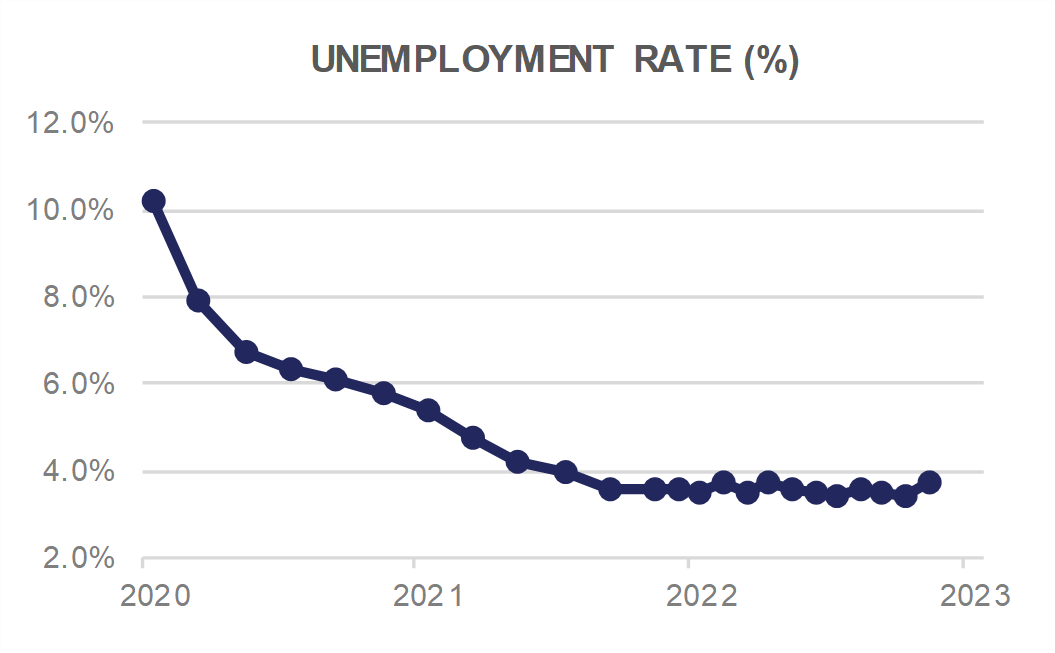
A bright spot here in the U.S. remains the labor market. The Unemployment Rate for May edged higher to 3.7%, however a better than expected 339k jobs were created. Average Hourly Earnings ticked up by +0.3% (+4.3% YoY) while Average Weekly Hours held steady at 34.3. Initial Jobless Claims averaged 249k over the past 4 weeks and have yet to signal near-term weakness for the labor market.
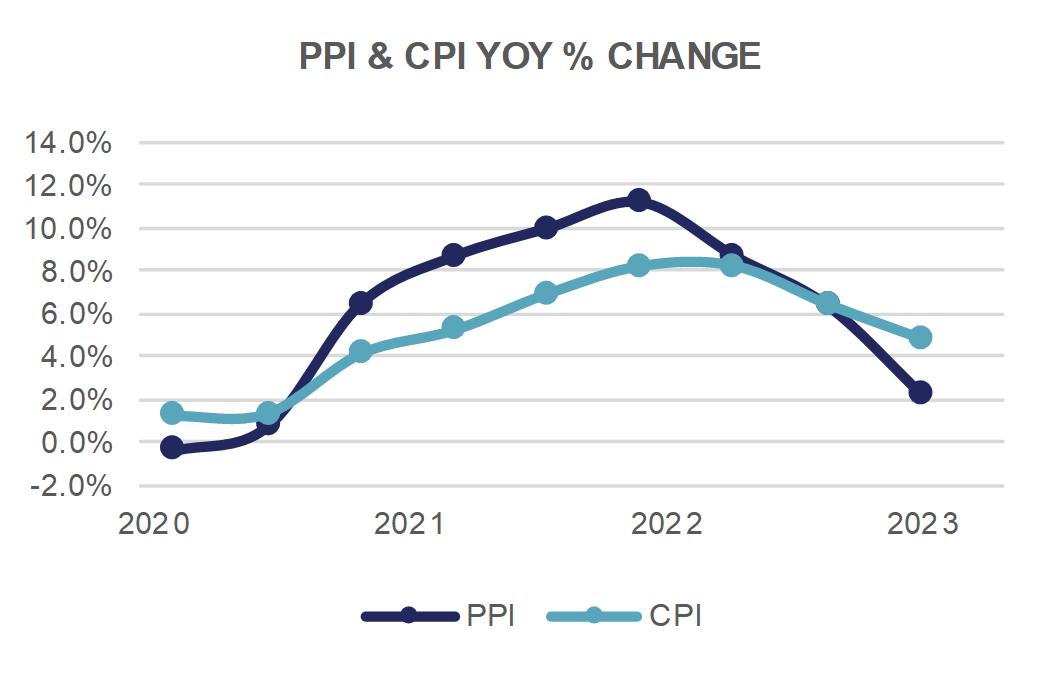
Inflationary pressures remained somewhat sticky in June, with CPI for May showing a meager +0.1% uptick and core CPI a more robust +0.4% rise. Producer Prices, however, fell more than expected, dropping -0.3% for the month, and up just +1.1% YoY. Core PPI edged higher by +0.2 MoM and +2.8% YoY. The PCE Core Deflator reading for May showed a +0.3% increase (+4.6% YoY). While prices for goods continue to fall, service price inflation remains problematic and could trigger further monetary tightening from the Federal Reserve.
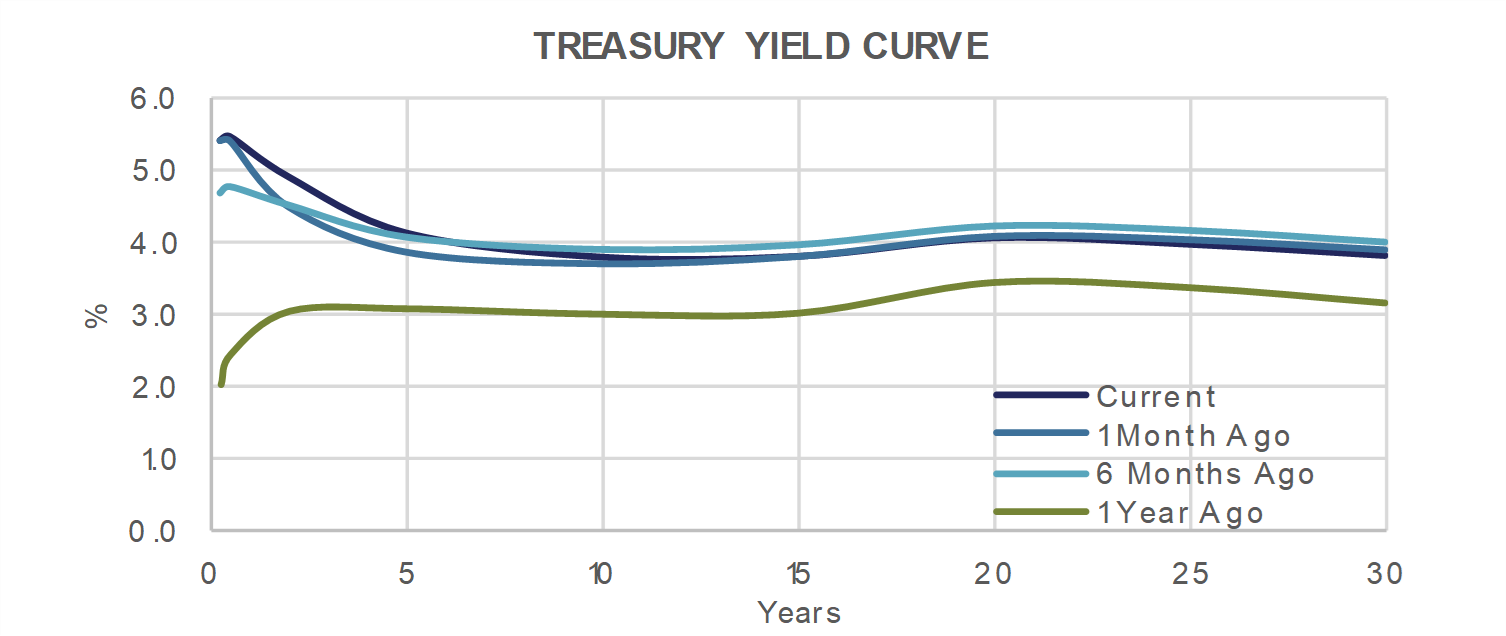
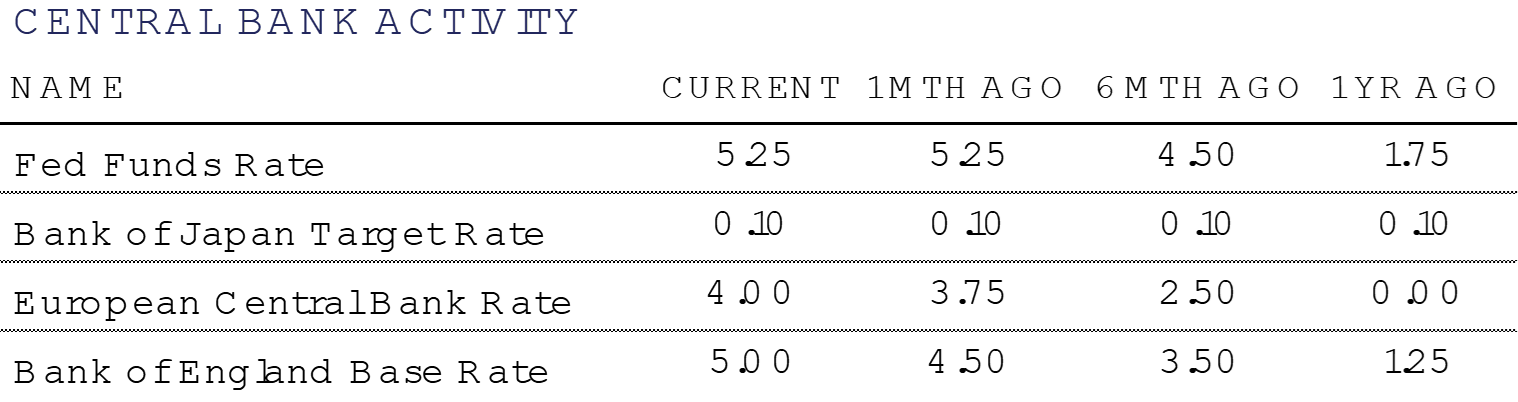
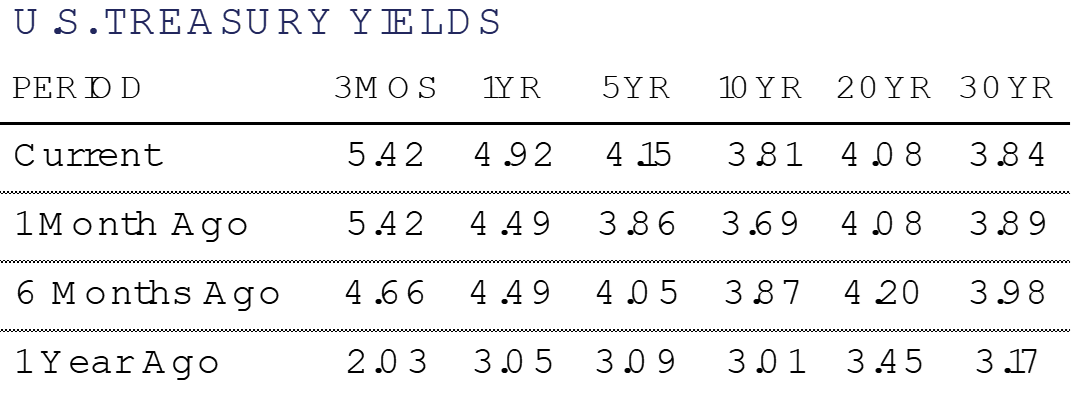
The Federal Reserve opted for a pause at its June FOMC meeting, citing the lag effects of monetary policy. Chair Powell did indicate, however, that future rate hikes were likely and that the battle against inflation is still being waged. Markets are currently pricing in a 85% chance of a 25 basis point hike at the July 26 FOMC meeting, while the Dot Plot from the recent meeting suggested a terminal Funds rate of 5.50% to 5.75% by year-end. The bond market continues to price in future rate cuts, however, with the 10-year yield still below 4%. Time will tell if Mr. Market knows something we don’t.
Domestic Equity
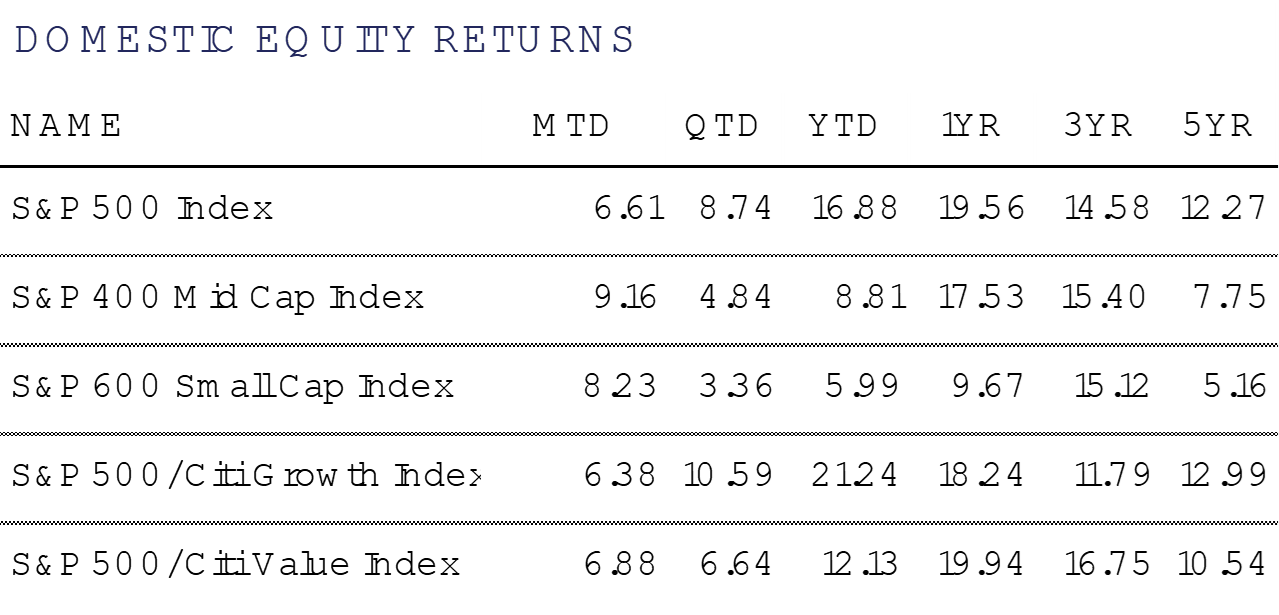
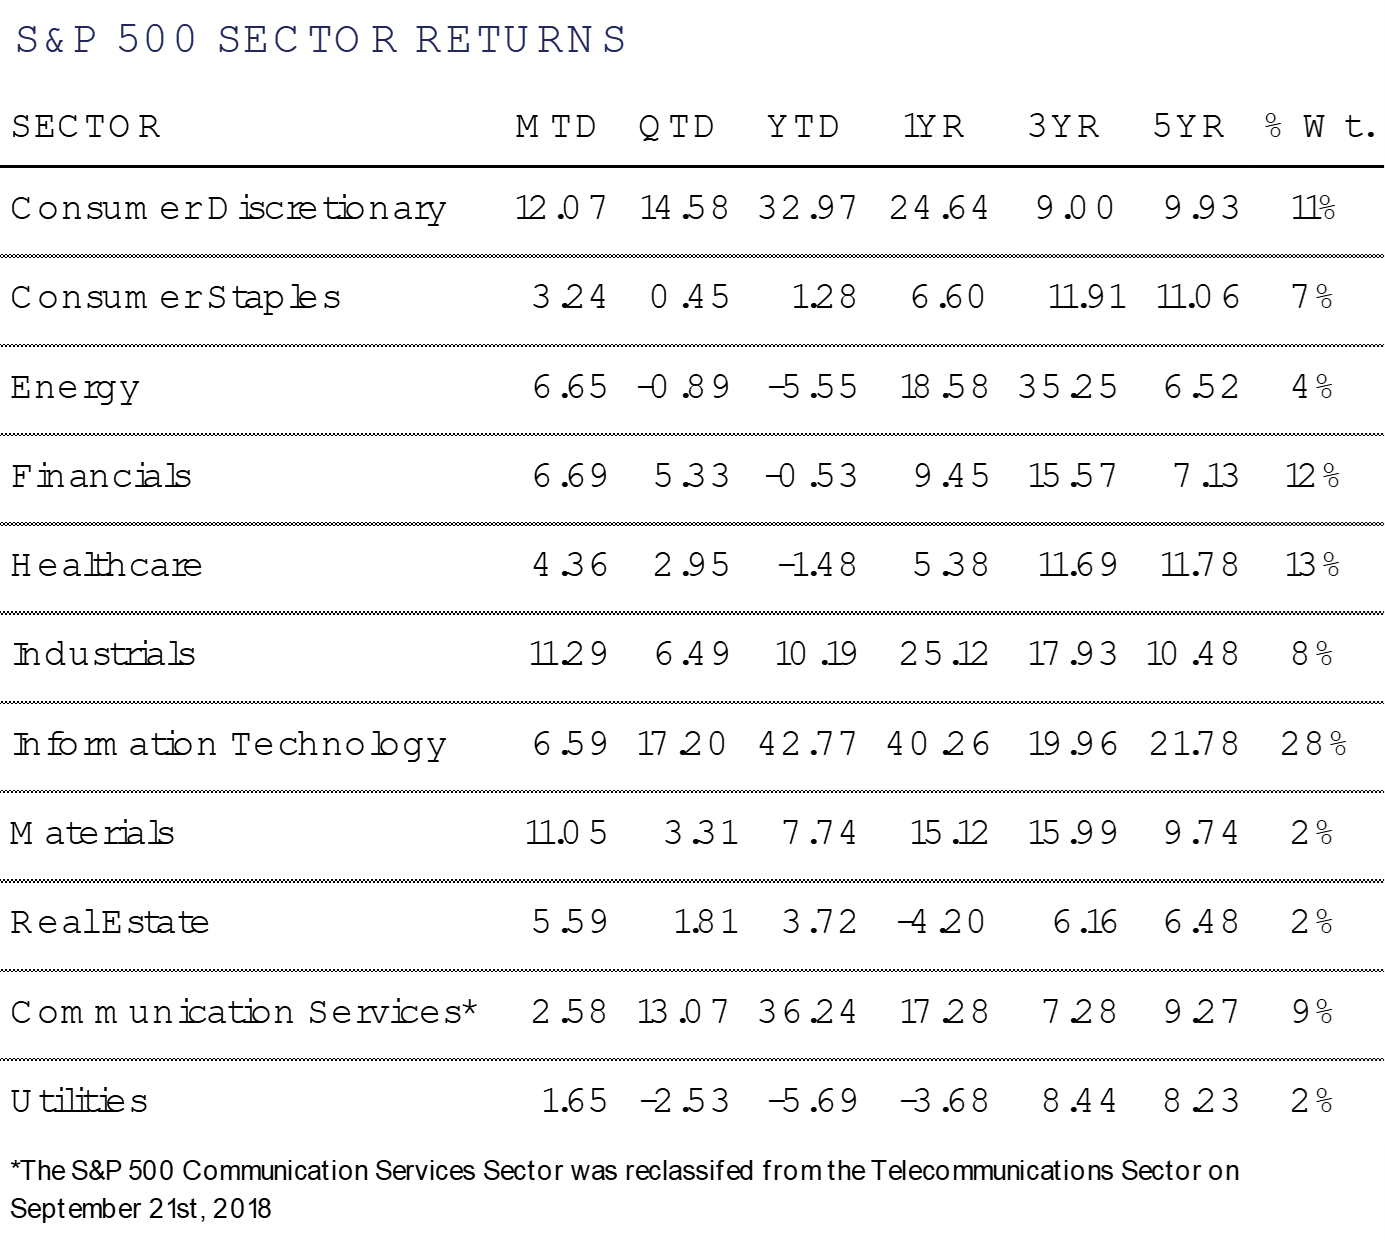
US Equities rocketed higher in June, with the benchmark S&P 500 Index gaining +6.6% to close at 4,450. Mid- and Small-Caps fared even better, with the S&P 400 & 600 Indices gaining +9.2% and +8.2%, respectively. The outperformance of Mid- and Small-Caps was greeted with fanfare, as signs that the market may be broadening out pushed markets higher.
At the halfway point in the year, the market rally has been driven by mostly a handful of names surging, and the rest of the market being left behind. The S&P 500 has risen +16.9% YTD, more than doubling the performance of Mid- and Small-Caps, which are up +8.8% and +6.0%, respectively. Year to date SMID cap performance came almost entirely in June.
The tale of the tape quite simply has been the top stocks by market cap that have soared year to date, with Apple gaining +49.7% to a more than $3 Trillion market cap, Microsoft rising +42.7%, Amazon rebounding +55.2%, NVIDIA surging by +189.5%, Google powering higher by +36.3%, and Meta racing ahead +138.5%. Oh, and Tesla gained +112.5%. While most of these stocks had terrible performances in 2022, they’ve more than made up for it in 2023. Economic surprises have been to the upside, inflation surprises to the downside, and the labor market continues to fire on all cylinders, complicating things for the Fed.
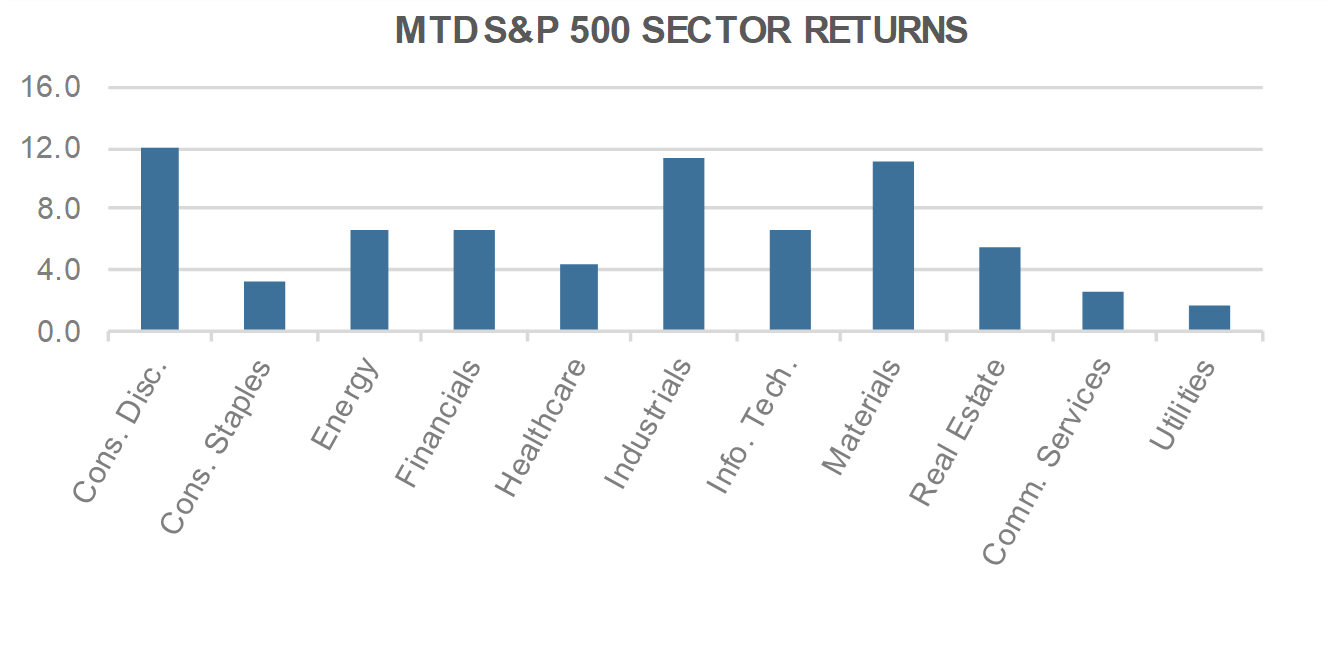
Furthermore, the top heaviness of the market can be seen in the fact that 4 of 11 sectors are in the red for the year (Utilities, -5.7%; Energy, -5.6%; Healthcare, -1.5%; and Financials, -0.5%), and an additional 4 of 11 sectors have posted positive gains, but lagged the overall market by a wide margin (Industrials, +10.2%; Materials, +7.7%; Real Estate, +3.7%; and Consumer Staples, +1.3%).
Looking ahead to the back half of the year, all eyes will be on the inflation and employment pictures. Barring an upside inflation surprise or a material crack in the employment picture, a broadening out of the market rally may be in the cards.
International Equity
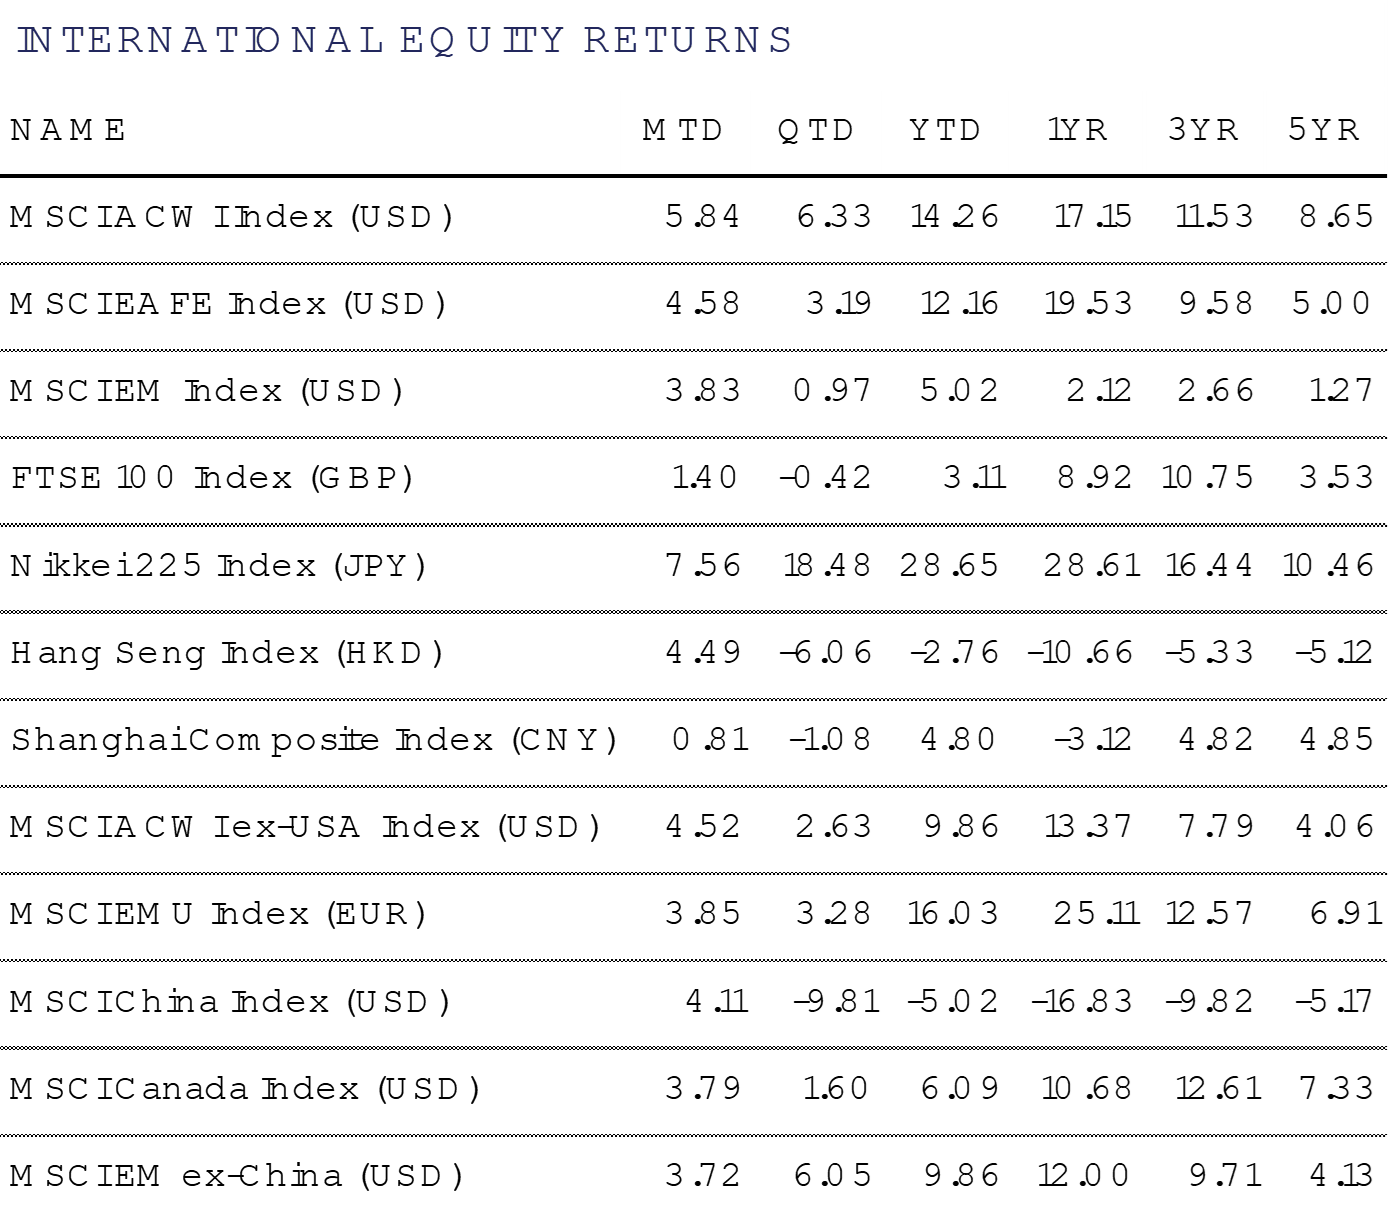
International risk assets rallied with most major indices tracked providing positive returns during the month of June. Developed Markets (DM), as measured by the MSCI EAFE Index returned an impressive +4.6% during the month (in USD terms)
while Emerging Markets (EM), as measured by the MSCI EM Index returned +3.8%. On the year, DM has outperformed EM by more than 7%, but still lags Domestic US equities by almost 5%.
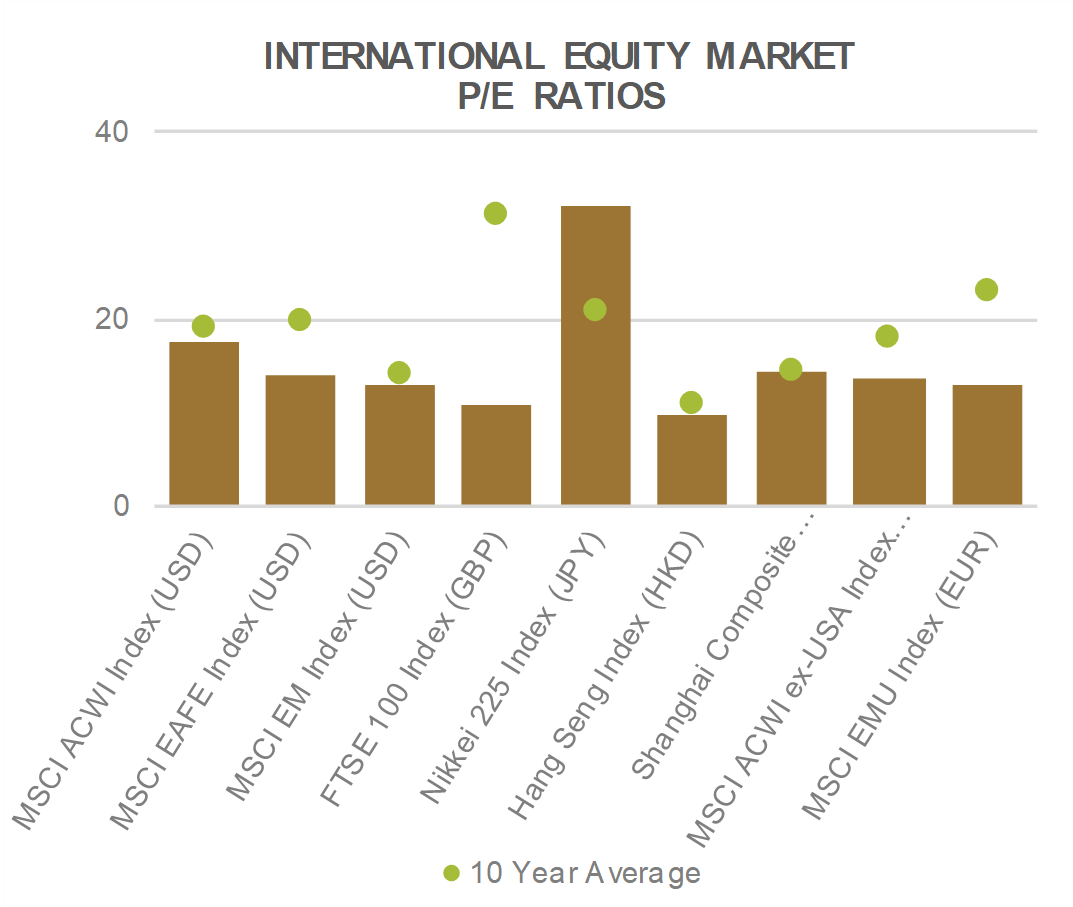
Positive economic data out of Europe helped the MSCI EMU Index return +3.9% in Euros during June as annual inflation in the eurozone slowed for the third straight month to 5.5% in June from 6.1% in May. While noting that
they had made progress in their battle against inflation, European Central Bank President Christine Lagarde said
that they cannot declare victory yet and that it was unlikely they have reached peak interest rates – pointing towards a likely hike during their July meeting. As we come to a close on the first half of 2023, the MSCI EMU has returned an impressive +16.0% (in EUR terms).
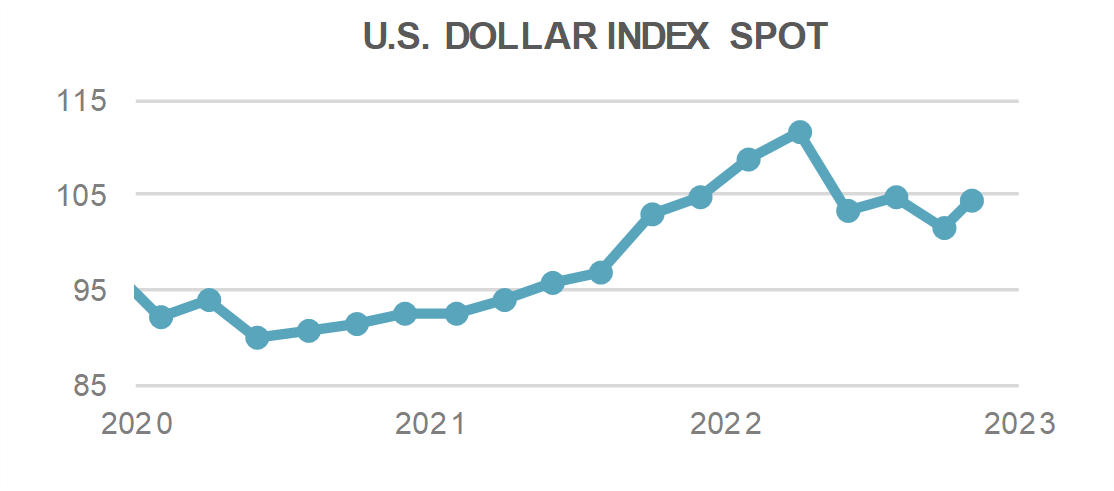
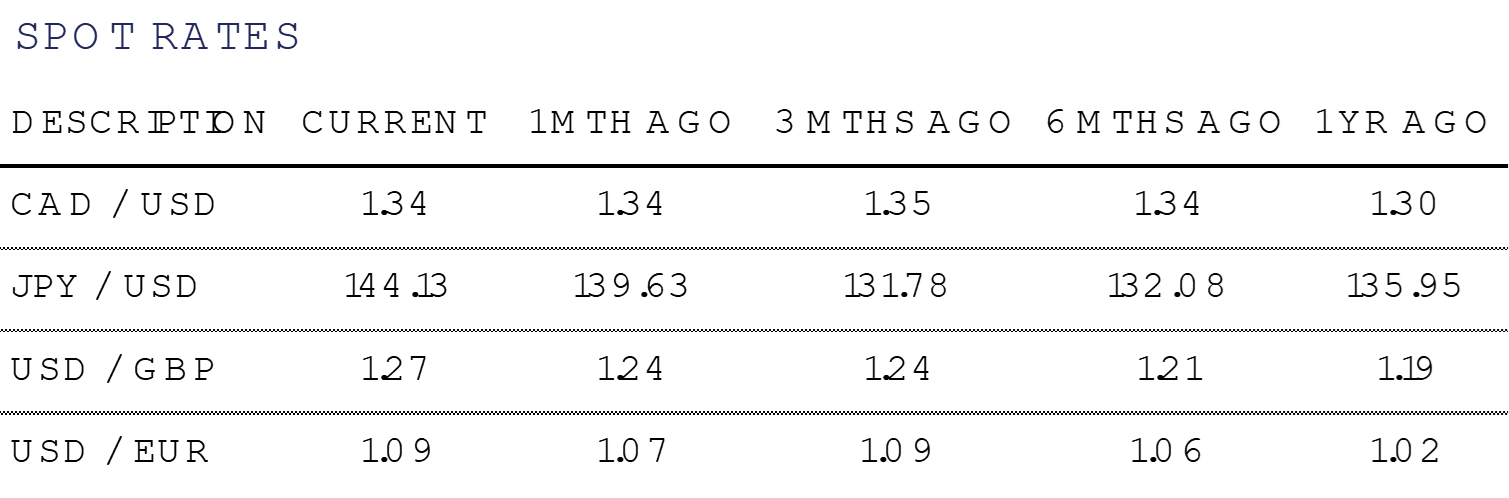
Another standout performer has been Japan with the Nikkei 225 Index returning +7.6% during the month of June, closing out the first half of 2023 by returning an impressive +28.7% YTD (in JPY terms). Although equity returns have been great for the region throughout the year, monetary authorities have kept an eye on foreign exchange markets as the Japanese Yen fell to a seven-month low of JPY 144.8 against the US dollar.
China took a sigh of relief during the month of June with the MSCI China Index returning +4.1% (in USD terms). Throughout the first half of the year, they remain one of the few regions in the red, posting a -5.0% drop YTD (in USD terms). China’s official manufacturing Purchasing Manager’s Index (PMI) inched up to 49.0 in June, from 48.8 in May; prints below 50 indicate a contraction in activity.
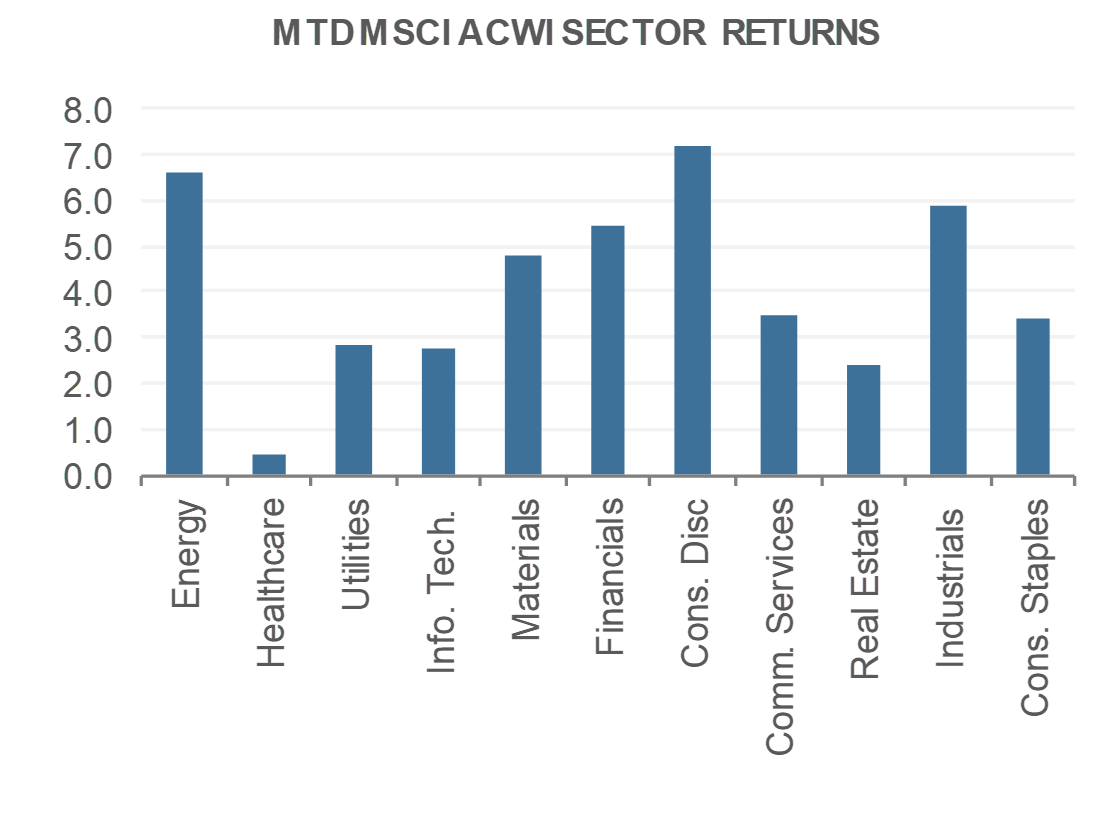
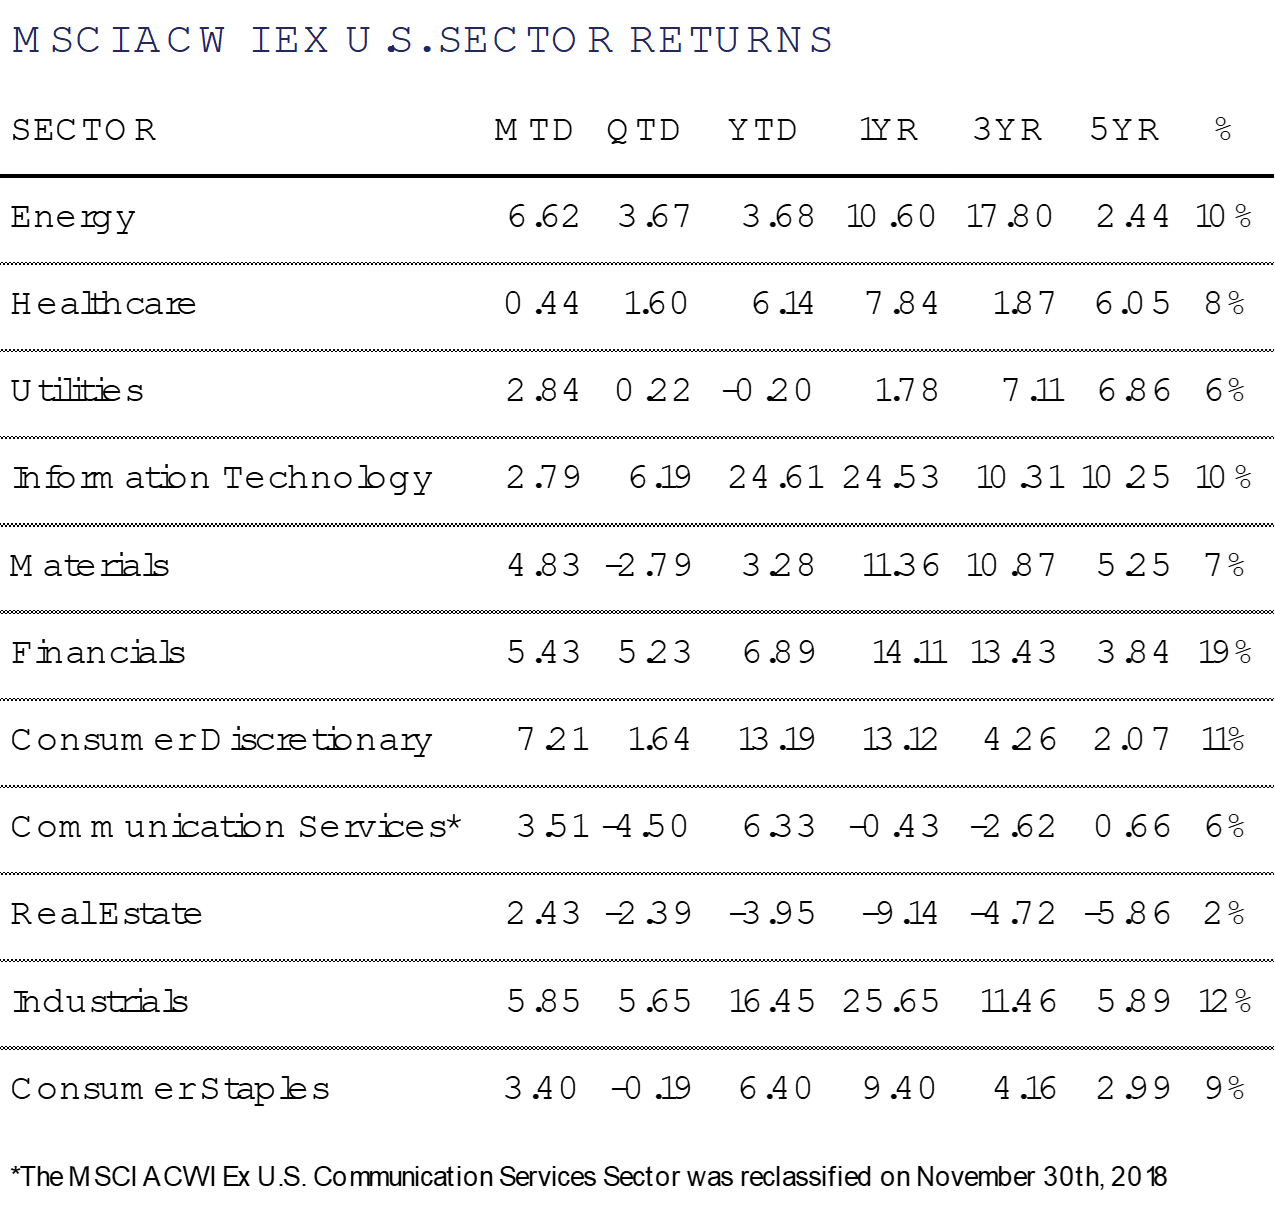
All eleven of the MSCI ACWI ex-U.S. sectors finished positive on the month, led by Consumer Discretionary and Energy, while Real Estate and Healthcare were the laggards.
Fixed Income
There has been significant interest in the future path of interest rates as charted by the Federal Reserve. Headline inflation has been declining while core inflation appears more stubborn. Would the Fed choose to pause (hold rates steady at current levels), or simply skip (not raise at the June meeting, but set the table for a rate hike in July)?
At the June meeting of the Federal Open Market Committee, it was decided that rates should be held steady, accompanied by hawkish dialog that prepared market participants for additional future rate increases. Perhaps the most hawkish piece of data was the two additional rate hikes that were reflected in the Fed’s Summary of Economic Projections released after the meeting. This was quickly followed by Fed Chair Jerome Powell’s comments at the European Central Bank Forum where he refused to rule out two consecutive rates hikes in July and September, noting that the risk of doing to little to reduce inflation remains.
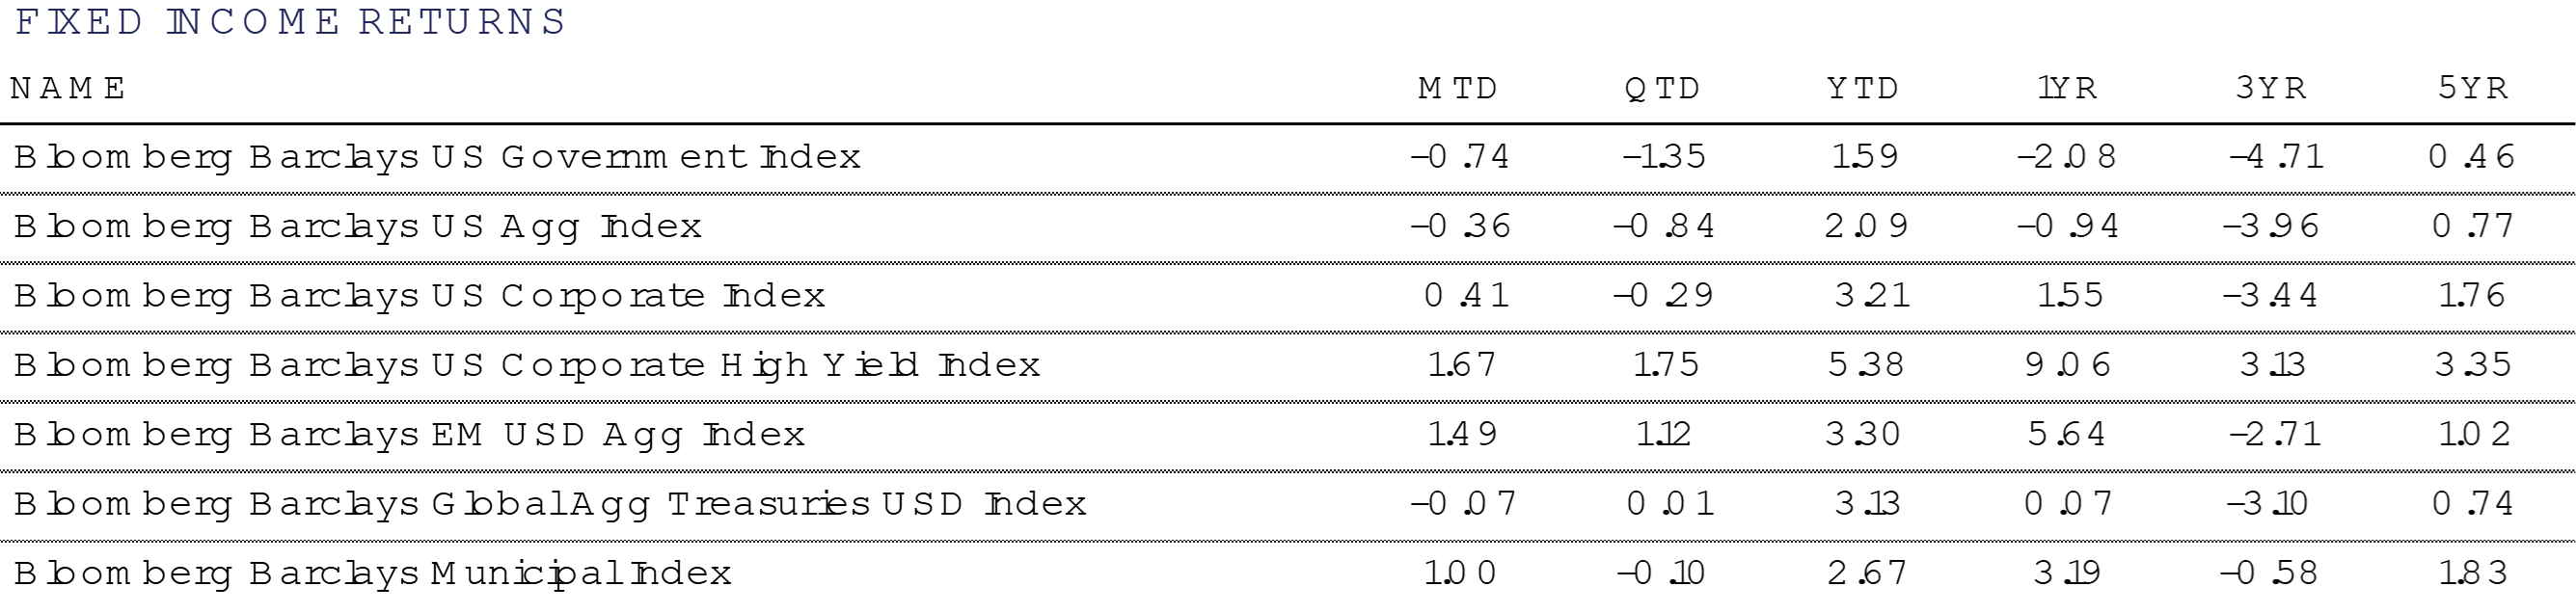
Treasury and Government bonds broadly underperformed in the month of June as interest rates moved markedly higher across most of the curve. The negative price impact created by the interest rate move overwhelmed the yield generated by high quality bonds.
Tax-free municipal bonds were able to post a positive return of +1%. This was driven by muni bonds becoming more expensive in relation to Treasury bonds during the month of June. As Treasury yields moved higher, municipal yields stubbornly held their ground, refusing to participate in the adjustment. This is not unusual, as muni yields often adjust to market moves with a slight time lag.
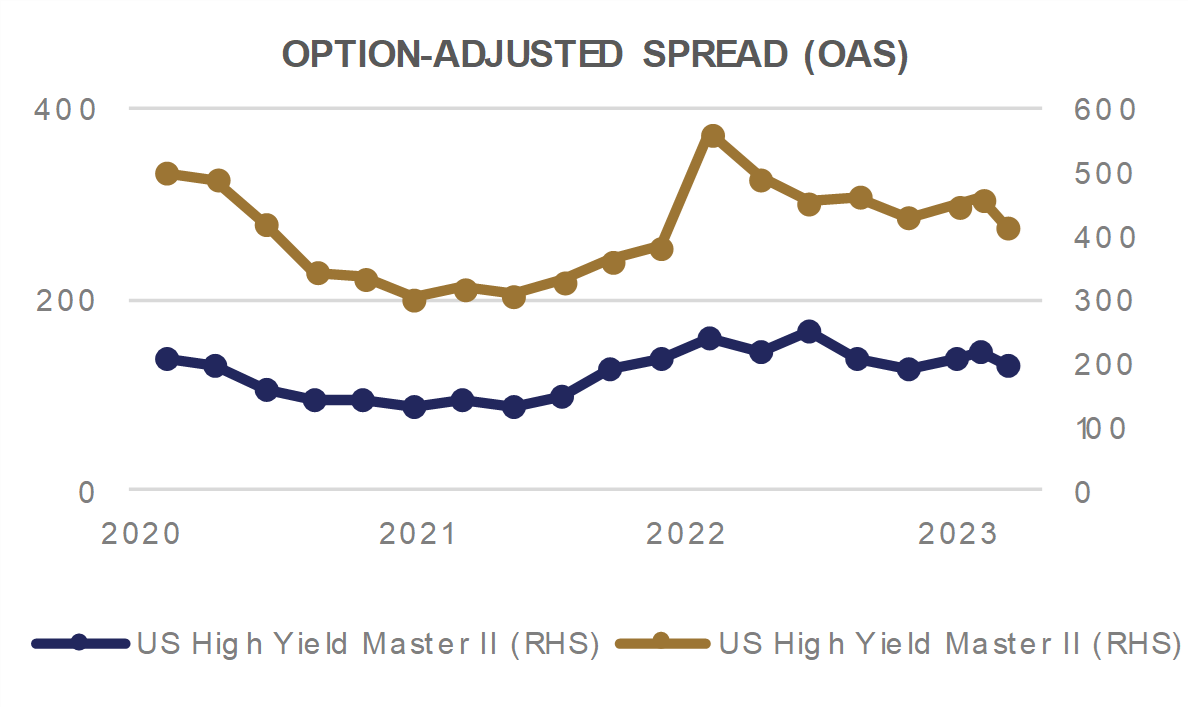
Lower quality fixed income performed best in the month, with High Yield corporate bonds leading the way. The additional yield provided by Investment Grade and High Yield bonds, combined with significant spread tightening in the month, was more than enough to counteract the rising rate environment and allow both sectors to post gains.
Alternative Investments
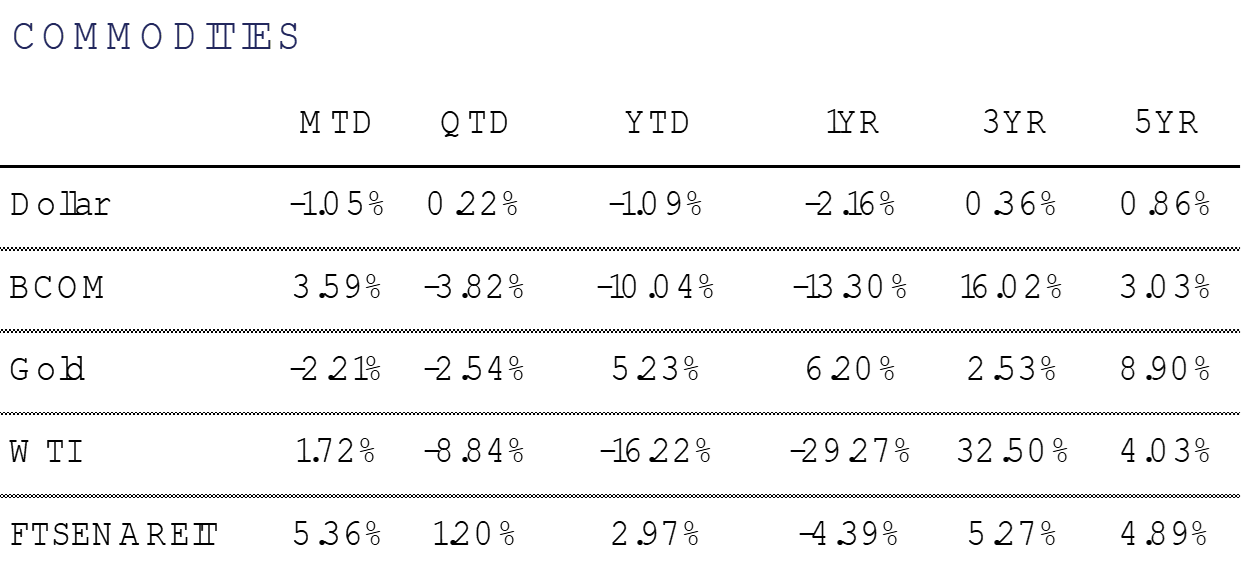
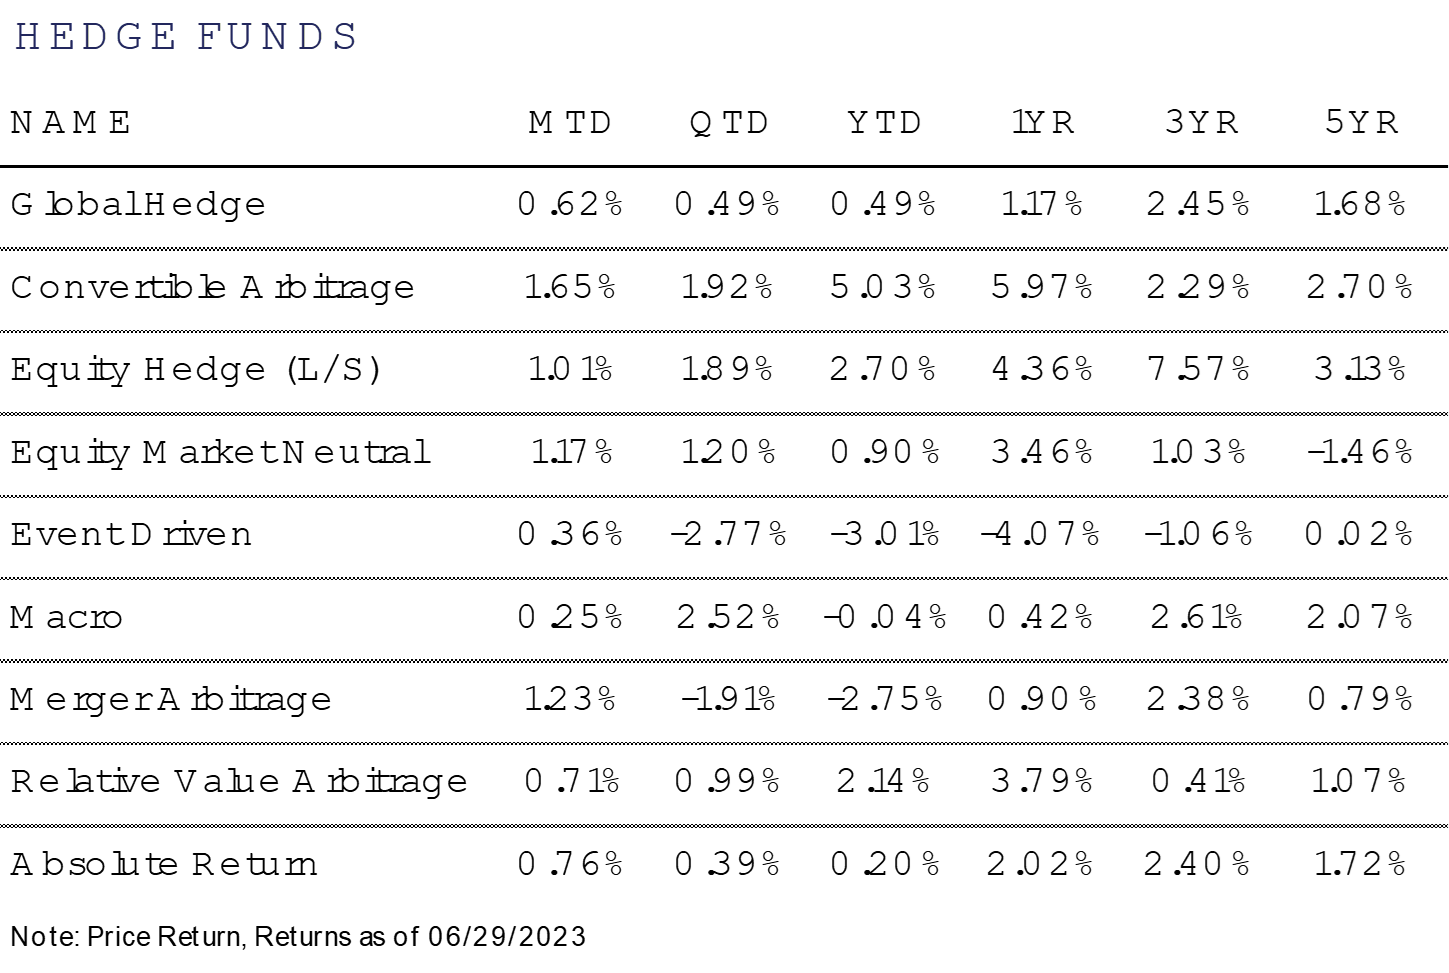
Alternative investments were mainly positive for June. Broad commodities, as measured by the Bloomberg Commodity Index, returned +3.6% for the month but declined -3.8% during the quarter. While alternatives are often valuable as portfolio diversifiers, they may now face a higher hurdle for portfolio inclusion in a higher rate environment when compared to Treasury Bills that yield over 5%.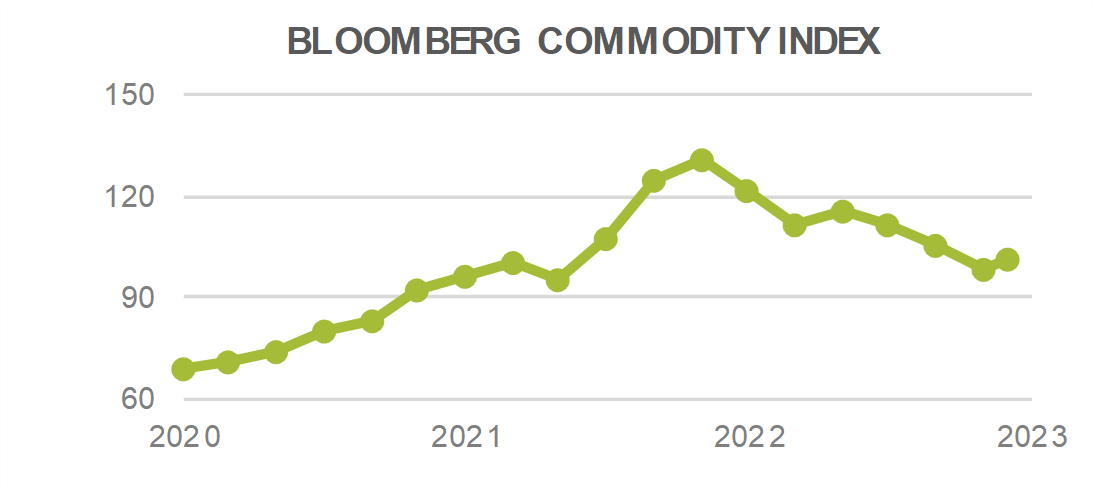
Food prices are among the commodity prices that have softened so far this year, helping ease inflation pressures. However, widespread drought conditions, particularly in the breadbasket of the United States, has led to recent volatility in crop prices. Over half of 
the Midwest is considered to be in a moderate drought or worse, creating production uncertainty for corn, soybeans, and other crops. Wheat contract prices were up roughly +7% in June while Soybean contract prices rose about +17% during the same period. A warm, dry start to summer is also affecting agricultural commodities at the same time that the Ukraine-Russia deal to export grain is set to expire in July.
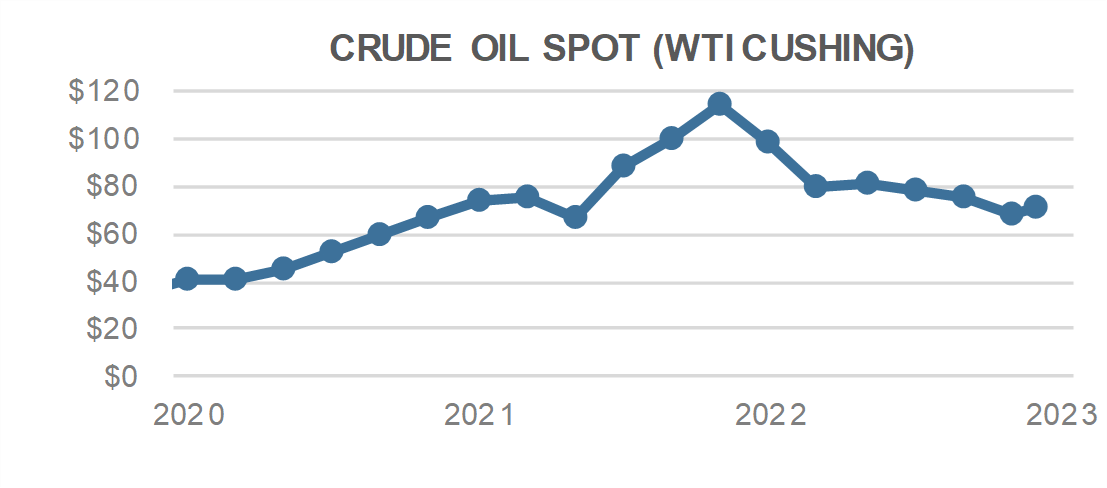
The price of WTI Crude Oil rose +1.7% during June but has fallen sharply YTD. Lower crude oil prices have helped lower gas prices, as the AAA National Average Gas Price of $3.52 (as of July 4th) has fallen over 30% from its highs last summer. Lower gas prices combined with a resilient consumer looking to spend on travel was expected to contribute to a record amount of Americans traveling for Independence Day.
For more news, information, and analysis, visit the ETF Strategist Channel.