
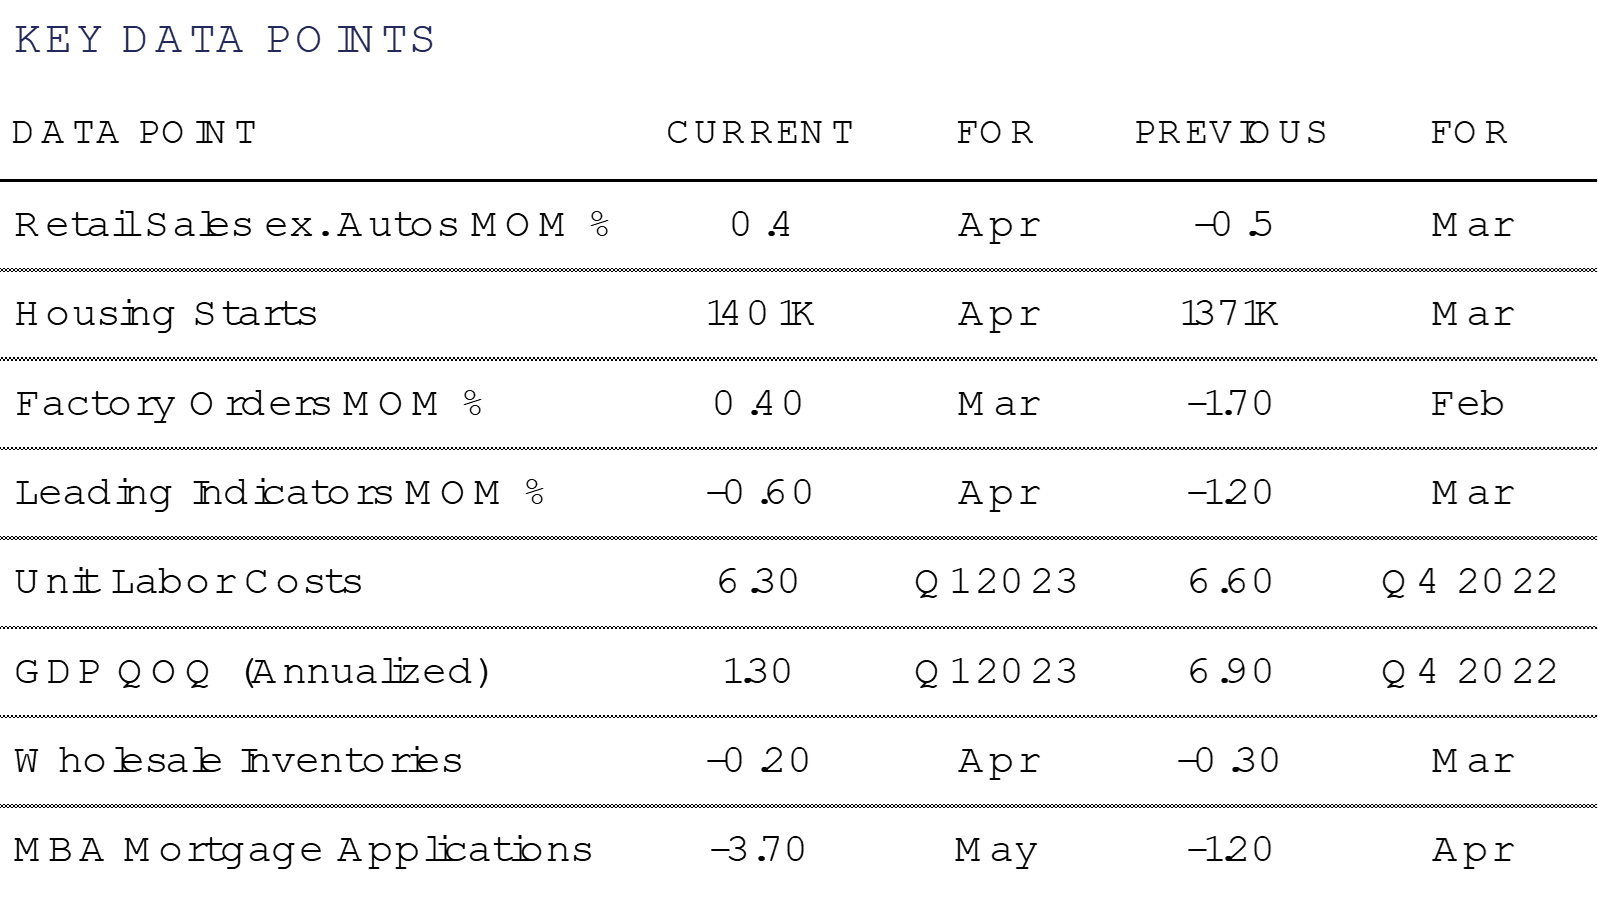
Forecasts for a near-term recession were dealt a blow in May as the U.S. Unemployment Rate dipped to 3.4%, the Job Openings survey for April surged back over 10mm, and U.S. Q1 GDP was revised upward to reflect a 1.3% growth rate. Certainly cracks are beginning to appear in the form of an increasingly stretched consumer struggling with sticky inflation, rising credit card delinquencies and sub-50 PMI readings suggesting manufacturing contraction. Added to all that is a higher short-term interest rate, with the Federal Open Market Committee raising the Fed Funds rate by 25 basis points at it’s May meeting. The jury is out on further Fed rate hikes, with FOMC members offering conflicting signals as to whether the Fed might pause in June, or continue raising rates to battle stubborn inflation.
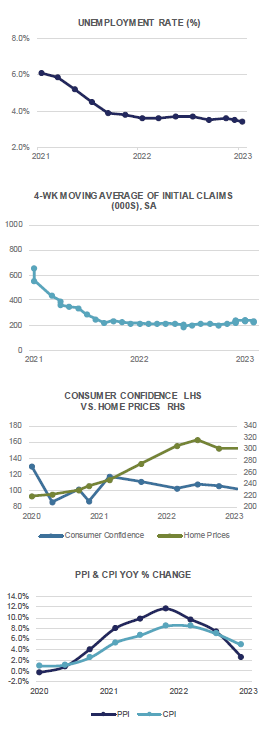
With a better than expected 253k jobs added in April, the U.S. Unemployment Rate dipped to 3.4%, while the U6 rate (a measure of underemployment) fell to 6.6%. Average Hourly Earnings rose a higher than expected +0.5% MoM, translating to a +4.4% YoY increase. Notably, Q1 Unit Labor Costs surged by +6.3%, handily beating estimates for a +5.6% increase. As mentioned above, the JOLTS (US Job Openings and Labor Turnover Survey) reading for April saw a move back above 10mm, indicating a still strong demand for labor here in the U.S.
On the inflation front, goods inflation would appear to be falling while services inflation remains problematic. CPI rose +0.4% MoM in April (+4.9% YoY), while ex Food & Energy, prices are up by +5.5% over the past year. Producer prices edged up a more modest +0.2% MoM (+2.3% YoY), which suggests lower prices may be getting closer to the consumer. Housing, specifically the categories of Shelter and Owners-equivalent rent, remains sticky despite the rise in mortgage rates. This should keep upward pressure on headline numbers for the time being.
The Federal Open Market Committee convenes again on June 14th and markets are currently assigning a 30% chance for a 25 basis point rate hike. There appears to be a growing movement on the FOMC for a pause, however, robust economic data reports would suggest the Fed still has an inflation problem. Perhaps not until we begin to see cracks in the labor market will the Fed feel it can take its foot off the brake. With the debt-ceiling issue likely behind us for now, all eyes will remain on central bank monetary policy for clues as to the future direction of the U.S. economy.
Domestic Equity
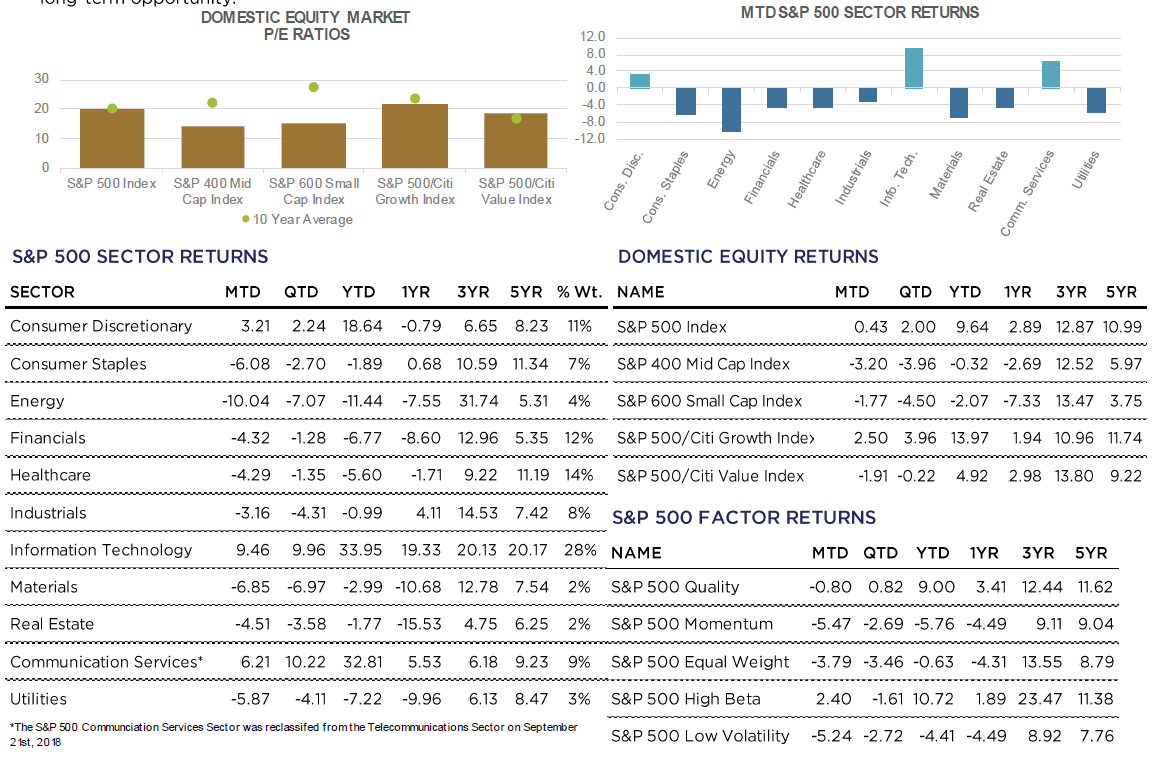
U.S. Large-Cap equities eked out a small gain in May with the benchmark S&P 500 Index gaining +0.4% to close at 4,180. Mid- and Small-Caps, as measured by the S&P 400 and 600 Indices finished firmly in the red, losing -3.2% and -1.75%, respectively. For the year, Large-Caps have posted strong gains, up +9.6%, thanks to narrowing breadth and Mega-Cap leadership, as evidenced by the S&P 500 Top 50 Index posting gains of +4.0% in May and +20.4% on the year. Mid- and Small-Caps remain in negative territory.
From a style perspective, the S&P 500 Growth Index has trounced Value on both a month to date and year to date basis, thanks to the aforementioned Mega-Cap leadership. For May, Growth posted returns of +2.5% compared to -1.9% for Value. For the year, Growth has gained +14.0%, compared to a mere +4.9% for Value.
Under the surface, gains in the market can largely be attributed to only a handful of stocks, most notably Apple (+36.8% YTD), Microsoft (+37.6%), Google (+39.0%), Amazon (+43.6%), Meta (+120.0%), Tesla (+65.6%) and Nvidia (+158.9%). The latter became the newest entrant to the Trillion Dollar market cap club, with it’s market capitalization briefly topping the $1T mark this week on the back of blow out earnings and strong demand for its Artificial Intelligence powering GPU’s.
At the sector level, month to date and year to date gains have been concentrated in the same three sectors, again highlighting the narrowness of leadership in today’s market. Technology, Communication Services, and Consumer Discretionary, which returned +9.5%, +6.2%, and +3.2%, respectively on the month. For the year, and in the same order, returns have been even stronger, up +33.9%, +32.8%, and +18.7%, respectively. All other sectors have posted losses, led by Energy, which lost-10.0% on the month and -11.4% on the year, thanks to lower oil prices and waning demand. Additionally, it is notable that even after the recent volatility in Financials post-SVB, Financials are not the worst performing sector year to date (down-6.8%). That position belongs to Energy and the traditionally defensive Utilities sector, which is down -7.2% year to date.
Lastly, looking at valuations, it should be noted that earnings revisions have started to stabilize. Earnings estimates for the S&P 500 stand just north of $222 for 2023, leaving the S&P 500 trading at 18.8x earnings. For 2024, estimates stand at $247, or 16.9x forward. Small-Caps, on the other hand, exchange hands for barely 12x next year’s estimates, and look like a compelling long-term opportunity.
International Equity
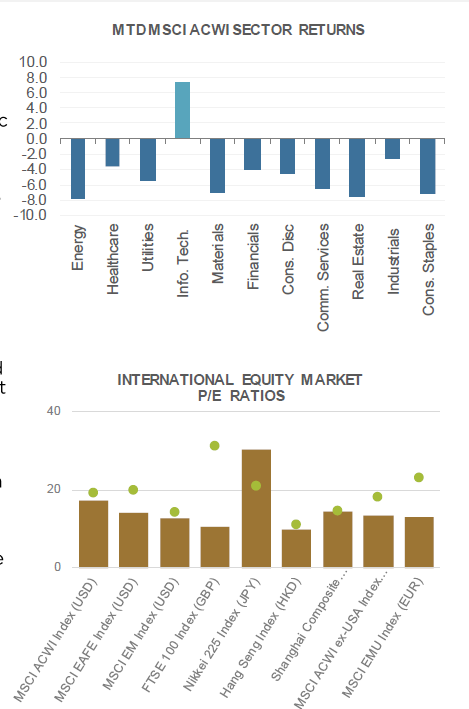
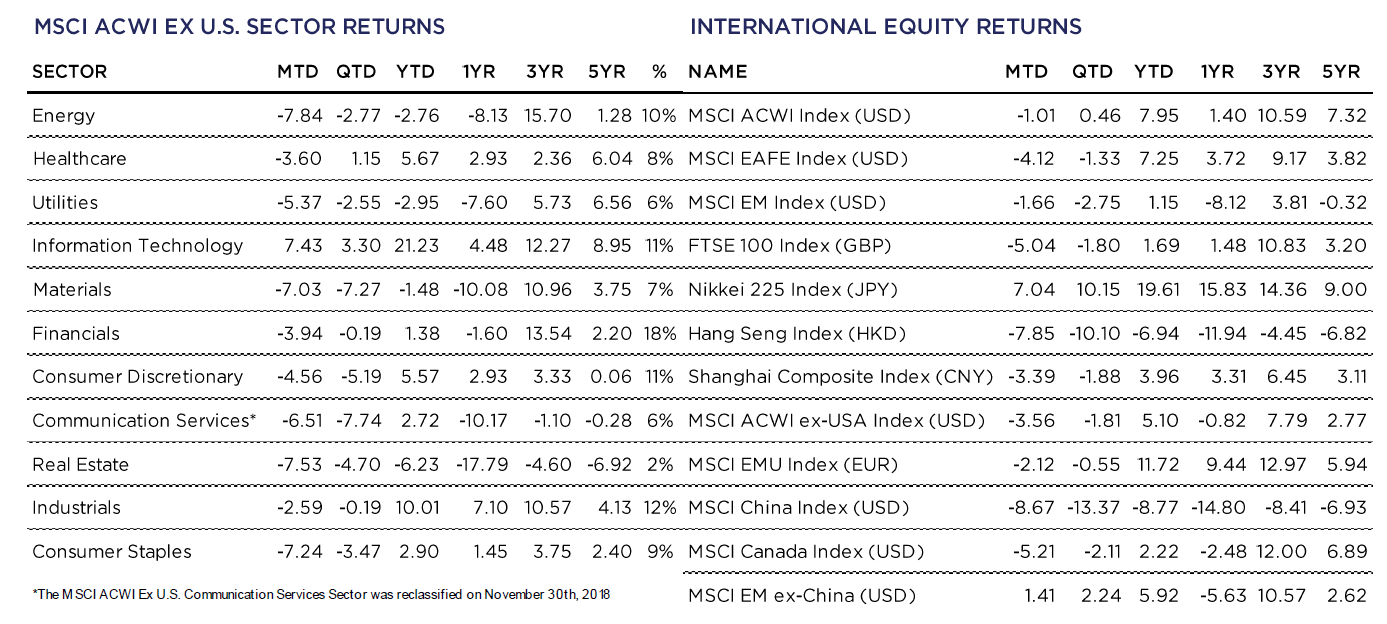
International risk assets underperformed their U.S. counterparts during the month of May with the MSCI ACWI ex-US Index falling -3.6%. Developed Markets (DM), as measured by the MSCI EAFE Index fell -4.1% while Emerging Markets (EM), as measured by the MSCI EM index lost -1.7%.
Shares in Europe fell during the month on continued signs that the economic outlook may be worsening. 14 of 16 countries contributed negatively to pan-European returns with the U.K. and France being the biggest detractors. During the month, the Eurozone fell -2.1%. While year-to-date, the region, as measured by the MSCI EMU Index is boasting a strong +11.7% return (in Euro terms).
In China, there was mounting evidence that the country’s re-opening trade may be losing steam. During the month, industrial output, retail sales and fixed asset investment all posted weaker than expected results which raised investors’ concerns around the economic outlook for Chinese markets. To add to geopolitical risk, Beijing announced that it was banning Chinese companies from buying products from Micron Technology, an American producer of computer memory and computer data storage. This was viewed by political observers as China’s most noteworthy retaliation to the US’ strict regulation on technology exports to China. On the month, the MSCI China Index fell -8.7% (In USD terms) and is down -13.4% on the 2nd quarter.
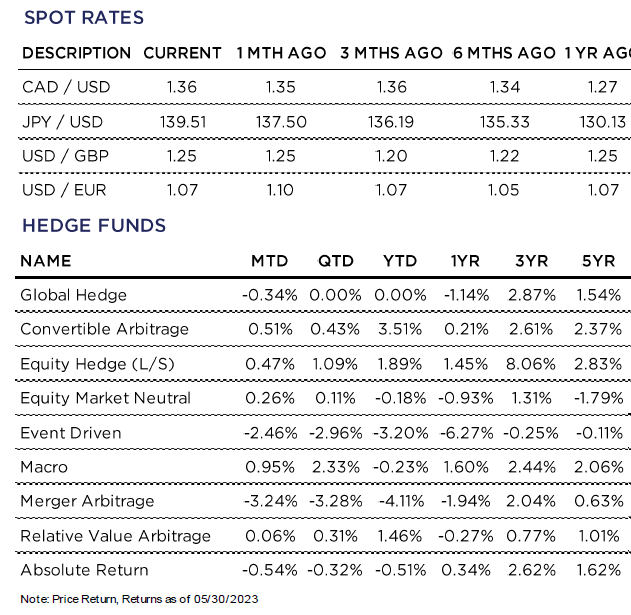
Perhaps the only bright spot in international markets was Japan. Manufacturing in the region expanded for the first time in seventh months in May. Tourism was also robust in the country, supporting a strong services sector. Japan’s Nikkei 225 Index briefly touched a 33-year high during the month, retuning +7.0%. On the year, the Index boasts an impressive +19.6% gain (in JPY terms). In the currency markets, returned speculation to US rate hikes and the Bank of Japan’s commitment to ultra-loose monetary policy drove the US Dollar to a six-month high against the Japanese Yen.
At the sector level, 10 of the 11 MSCI ACWI ex-US sectors posted negative returns with the lone standout being Information Technology, posting a +7.4% gain during May. Year-to-date, the sector has returned +21.2%, far outpacing all other sectors. The largest laggards were Energy (-7.8%), Real Estate (-7.5%), Consumer Staples (-7.2%) and Materials (-7.0%).
Fixed Income
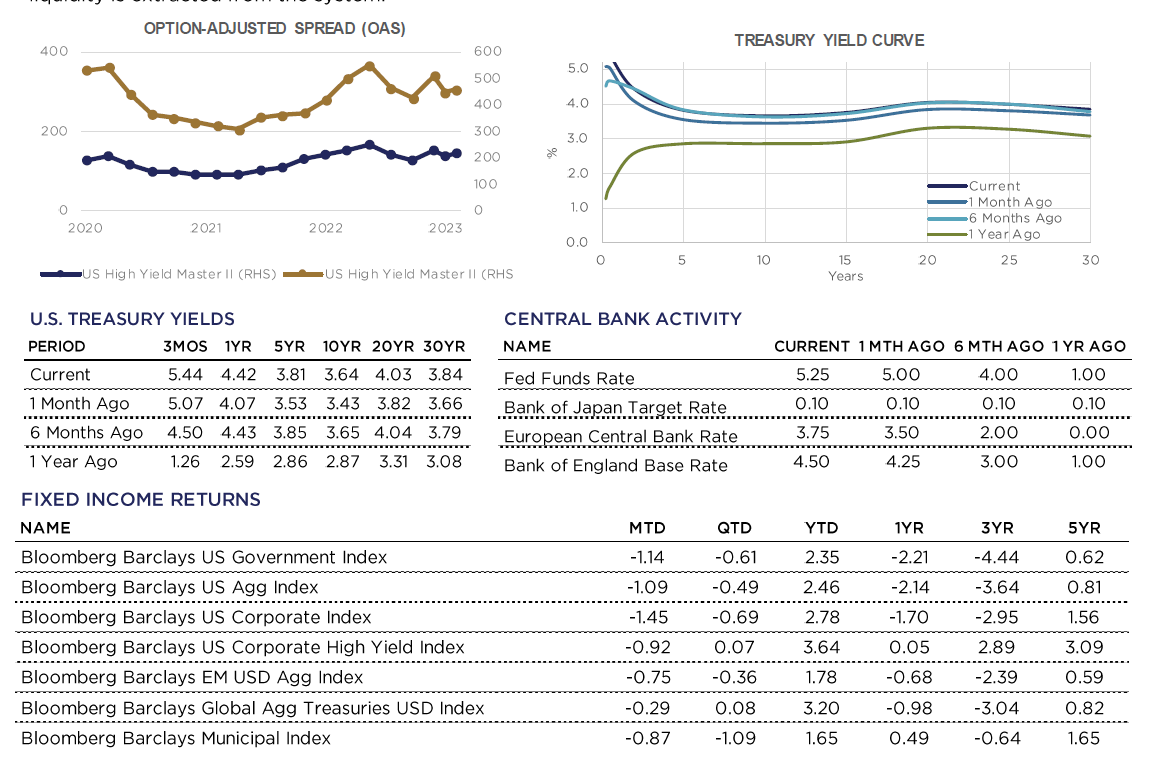
At the May 3rd FOMC meeting, the Federal Reserve raised the Federal Funds target rate by 25 basis points, to 5% to 5.25%. The next meting will be held on June 13th & 14th. Strong employment data releases and a few hawkish speeches given by Fed members has led the market to believe that we may see another hike at the coming meeting.
Yesterday, Nick Timiraos, known as the “Fed Whisperer,” published a Wall Street Journal article with the headline, “Fed Prepares to Skip June Rate Rise but Hike Later.” His track record of correctly framing Fed moves lends credence to the claim. Even as recent jobs data has come in stronger than expected, the Fed is apparently ready to pause and assess the need for additional monetary tightening. No doubt there will be debate over whether this is a prudent move in the Federal Reserve’s battle with inflation.
Interest rates moved higher across all maturities in May, resulting in broadly negative performance from Fixed Income. The U.S. Government bond index and the Aggregate index were both down a bit more than one percent.
Credit spreads widened in the month of May. This was a headwind for Investment Grade and High Yield corporate bond performance. The additional income earned by the High Yield index allowed it to outperform Investment Grade corporates and the higher credit quality U.S. Government and Aggregate index exposures.
Tax-free Municipal bonds have become more attractive relative to taxable bonds as their prices have moderated. Today’s levels are as attractive as we have experienced this year, but if market volatility picks up, we may very well see the recent trend of relative cheapening in Munis continue.
The Debt Ceiling agreement is moving through Congress, creating an expectation of significant Treasury issuance to refill depleted government coffers. The effects may be felt more broadly than just the fixed income markets, as liquidity is extracted from the system.
Alternative Investments
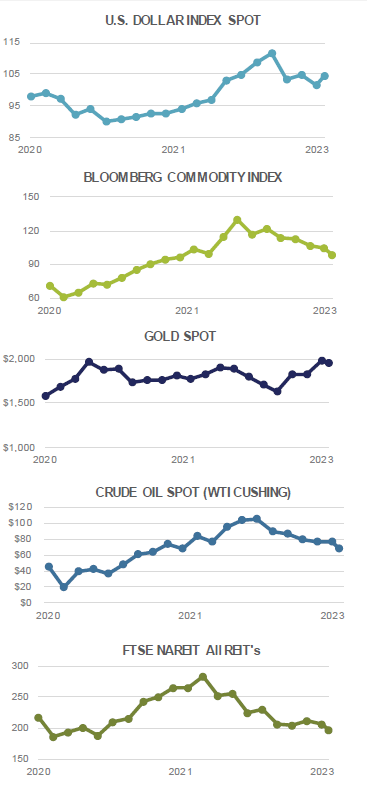
Alternative investments produced mainly negative returns in May. Broad commodities, as measured by the Bloomberg Commodity Index, fell -6.1% on the month. Fears of a potential global economic recession and a weaker than expected economic rebound in China were factors in the decline. China initially had a surge in consumer related activity earlier this year after the easing of COVID lockdowns but economic momentum has faded in recent months.
WTI crude oil prices fell -11.3% during the month, and are down -17.7% YTD. The slide has occurred despite numerous attempts by OPEC+ to cut production in an effort to prop up oil prices. In April, eight OPEC+ members agreed to voluntarily cut production by 1.2 million barrels a day in addition to the cuts they agreed upon in October of last year. However, new petroleum on the market from non-OPEC+ countries and the prospects of a global economic slowdown has weakened global demand.
Other areas of the energy market have also tumbled, as natural gas prices in Europe have fallen sharply from their peak seen last summer and US diesel prices have fallen over 30% from their highs. The broad decline in input prices is a welcome sign for both consumers and central banks that have been fighting sticky inflation. However, the decline in prices has been uneven and lower commodity or input prices does not always translate to lower priced end products for consumers. A stubbornly strong labor market and high housing costs are other economic data points showing the fight against inflation is still far from over.

For more news, information, and analysis, visit the ETF Strategist Channel.
Nottingham Advisors, Inc. (“Nottingham”) is an SEC registered investment adviser with its principal place of business in the State of New York. Nottingham and its representatives are in compliance with the current registration requirements imposed upon registered investment advisers by those states in which Nottingham maintains clients. Nottingham may only transact business in those states in which it is registered, or qualifies for an exemption or exclusion from registration requirements. This material is limited to the dissemination of general information pertaining to Nottingham’s investment advisory/management services. Any subsequent, direct communication by Nottingham with a prospective client shall be conducted by a representative that is either registered or qualifies for an exemption or exclusion from registration in the state where the prospective client resides.
The information contained herein should not be construed as personalized investment advice. Past performance is no guarantee of future results. Information contained herein should not be considered as a solicitation to buy or sell any security. Investing in the stock market involves the risk of loss, including loss of principal invested, and may not be suitable for all investors. This material contains certain forward-looking statements which indicate future possibilities. Actual results may differ materially from the expectations portrayed in such forward-looking statements. As such, there is no guarantee that any views and opinions expressed in this letter will come to pass. Additionally, this material contains information derived from third party sources. Although we believe these sources to be reliable, we make no representations as to the accuracy of any information prepared by any unaffiliated third party incorporated herein, and take no responsibility therefore. All expressions of opinion reflect the judgment of the authors as of the date of publication and are subject to change without prior notice. Past performance is not an indication of future results.
The indices referenced in the Nottingham Monthly Market Wrap are unmanaged and cannot be invested in directly. The returns of these indices do not reflect any investment management fees or transaction expenses. Had these additional fees and expenses been reflected, the returns of these indices would have been lower. Information herein has been obtained from third party sources that are believed to be reliable; however, the accuracy of the data is not guaranteed by Nottingham Advisors. The content of this report is as current as of the date indicated and is subject to change without notice.
For information pertaining to the registration status of Nottingham, please contact Nottingham or refer to the Investment Adviser Public Disclosure web site (www.adviserinfo.sec.gov). For additional information about Nottingham, including fees and services, send for our disclosure statement as set forth on Form ADV from Nottingham using the contact information herein. Please read the disclosure statement carefully before you invest or send money.
