
The recession debate remains front page news, bolstered mainly by the yield curve inversion of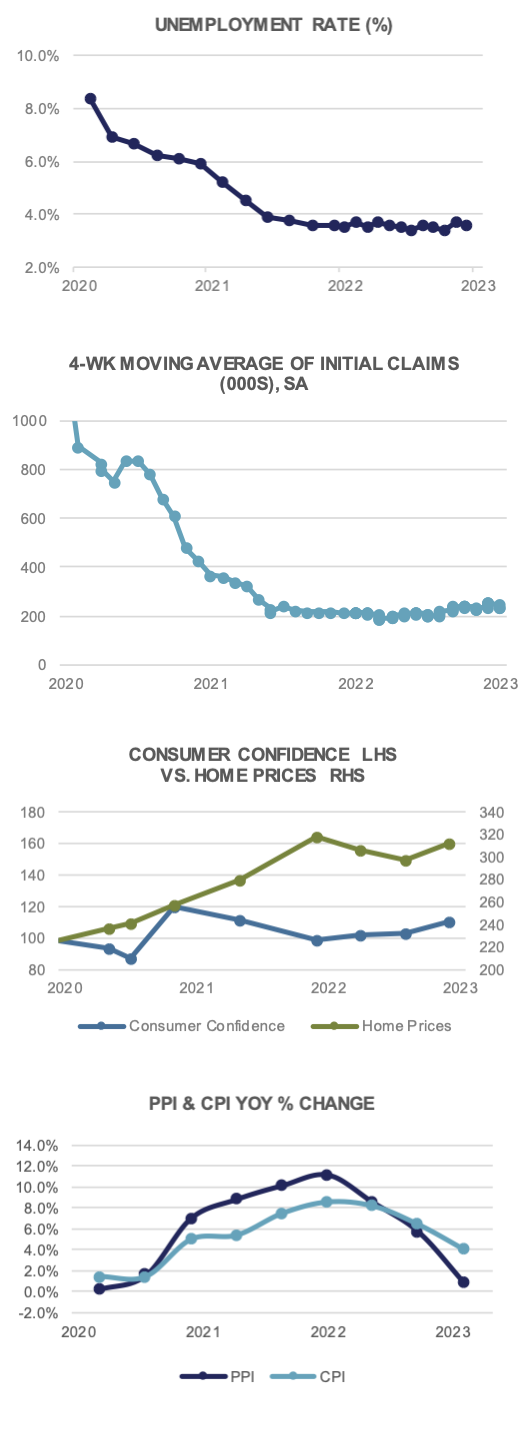 approximately -100 basis points between the 2yr and 10yr Treasury notes. Inverted yield curves have existed prior to every recession dating back to the 1950’s. So-called “no landing” advocates, meanwhile, point to Q2’s initial GDP read showing a better-than-expected +2.4% annualized rate of growth, along with the historically low level of unemployment here in the U.S., currently hovering around 3.6%. Only time, and the National Bureau of Economic Research, will tell if and when a recession has occurred.
Meanwhile, despite arguments that today’s low unemployment should forestall a decline in economic growth, history shows that U.S. recessions are typically preceded by very low unemployment figures. In the 1954 recession, unemployment surged from 2.6% to 6.0% in roughly one year’s time. In 1969, the jobless rate rose from just 3.5% to over 6.0% by 1971. The current U.S. JOLTS (Job Openings and Labor Turnover Survey) data for June showed a very robust 9.6 million job openings, high by historical measures. Conflicting signals remain prevalent across the economic landscape and for that reason, we remain neutral on the prospects for a near-term recession.
Inflation is still widespread in the economy, despite 525 basis points of interest rate hikes by the Federal Reserve. The PCE Core Deflator edged up +0.2% in June, or +4.1% YoY. Consumer prices ticked up +0.2% MoM as well, while PPI rose a mere +0.1%. This equates to +3.0% YoY for CPI and just +0.1% YoY for PPI. Back to the labor front, Average Hourly Earnings rose a higher than anticipated +0.4% in June, and remain up +4.4% YoY. It’s likely on the Fed’s radar as a sign of labor market strength, and will undoubtedly be monitored going forward as a measure of potential cooling off in the hiring space.
After taking a pause at their June meeting, the Federal Open Market Committee raised short-term rates by 25 bps in July. With no August meeting scheduled (although the Fed will be meeting in Jackson Hole, which has historically led to some economic volatility), the market is currently neutral on the odds for a September hike. Data dependent, as always, Fed Chair Powell will no doubt be monitoring the labor market closely, while also taking into consideration the broader price level here in the U.S. Markets are anticipating the Fed is at or near the end of its current hiking cycle, and if that were not the case, we will likely see much higher market volatility ahead.
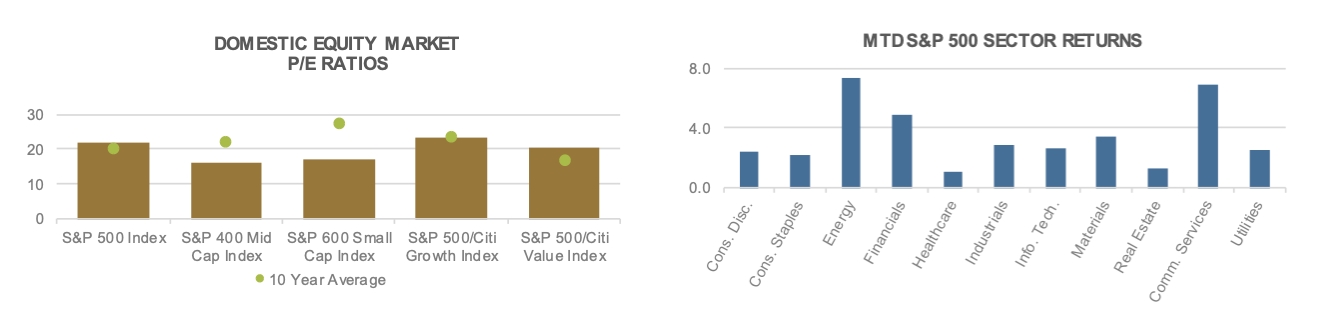
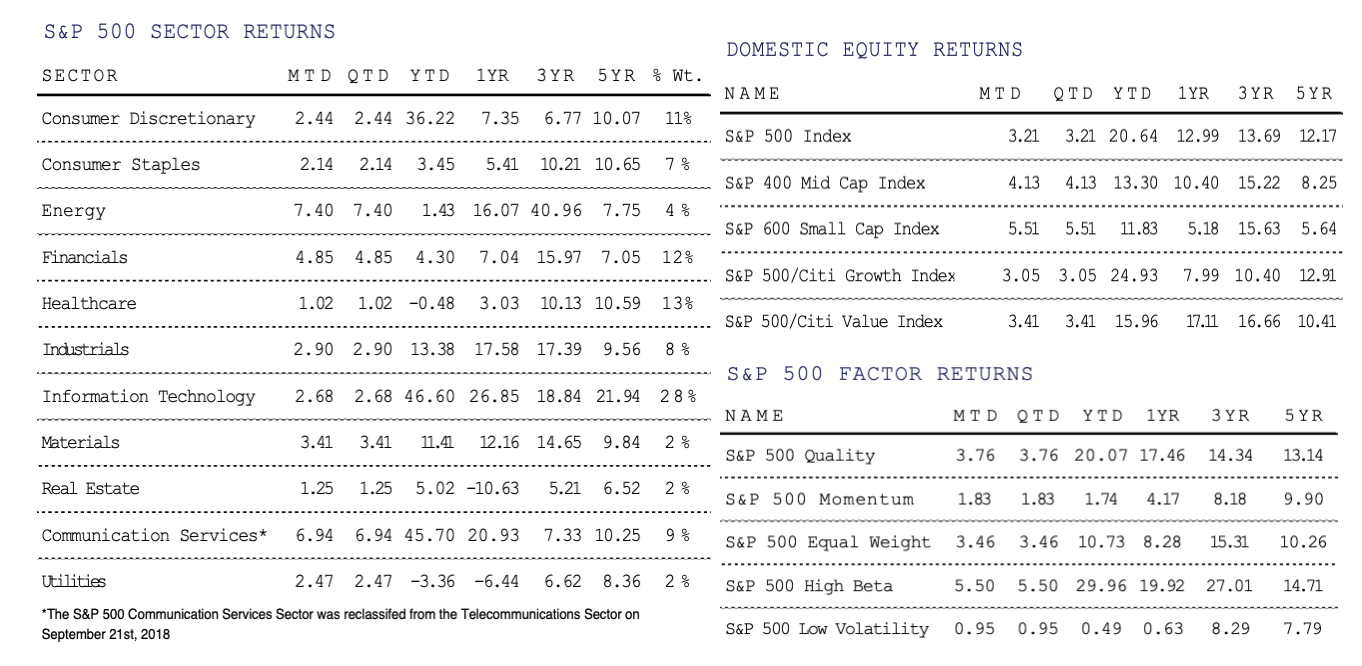
U.S. Equities continued their rise in July, with the benchmark S&P 500 Index gaining +3.2% to close at 4,588, hovering near a 16 month high led by the continued rise of mega caps and tech stocks. Meanwhile, Mid- and Small-Caps fared even better, with the S&P 400 & 600 Indices gaining +4.1% and +5.5%, respectively. The U.S. market rally has been catalyzed by a strong earnings season as investors are weighing the odds of a possible soft landing despite the Federal Reserve increasing interest rates by 525 basis points the last 16 months.
The S&P 500 has risen +20.6% YTD, as the rally has been marked by the outperformance of the largest seven companies in the index, often referred to as the Magnificent Seven. Apple (+51.6%), Amazon (+59.1%), Alphabet (+50.4%), Nvidia (+219.8%), Tesla (+117.1%), Microsoft (+40.7%), and Meta (+164.8%) make up approx. 30% of the Index as of the end of July. The combined market cap of these stocks has increased from $6.9 trillion to $11.5 trillion through the first seven months of the year. Large cap companies have nearly doubled the performance of Mid-Caps and Small-Caps through the first seven months of the year, which are up +13.3% and +11.8% respectively.
In spite of unremarkable sales growth and lower profit margins in Q2 for most S&P 500 companies, investors seem to be optimistic. The job market remains strong and earnings have largely beaten expectations. In fact, analysts in aggregate have increased their price targets of the S&P 500 to a range of 4,900-5,000 over a 12 month time frame, based on the assumption that companies will grow sales while reducing labor costs.
Looking ahead, all eyes will be on the remainder of second quarter earnings season. While Investors will also be watching the response by the Fed to future inflation prints and other economic data releases to hit the tape.
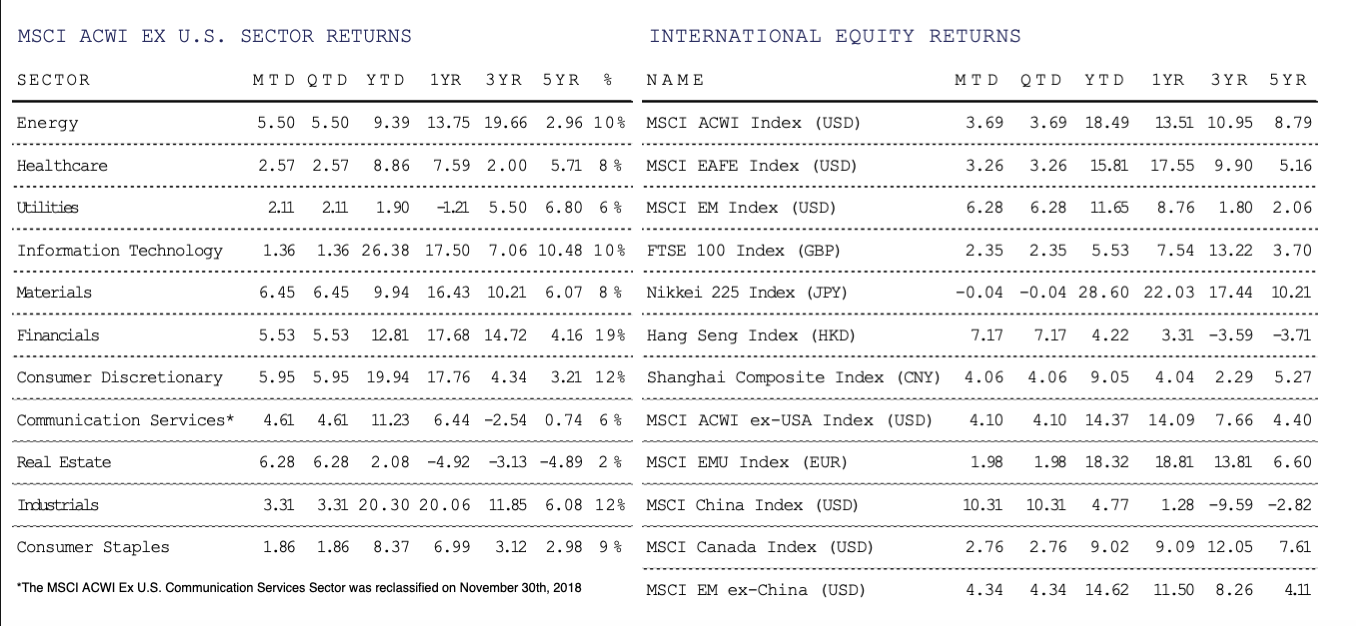
International risk assets enjoyed broadly positive performance during the month of July with the MSCI ACWI ex-USA Index gaining +4.1% (in USD terms). Developed Markets, as measured by the MSCI EAFE Index returned +3.3%, while Emerging Markets, as measured by the MSCI EM Index, gained an impressive +6.3% (both in USD terms). Despite the strong month, Emerging Markets still lag Developed Markets by more than 4% year-to-date.
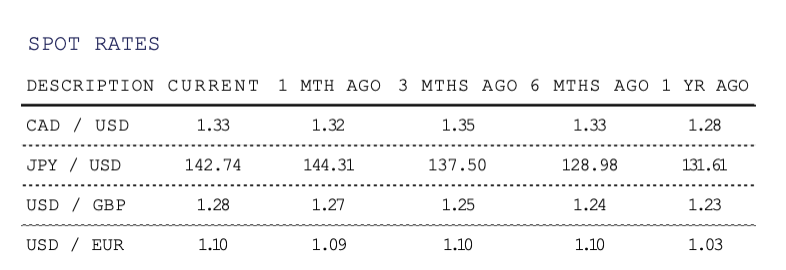
Perhaps one of the most interesting market drivers during the month of July occurred in the world’s third largest economy. The Bank of Japan surprised markets by announcing greater flexibility to its Yield Curve Control (YCC) policy. The BOJ held short-term interest rates at -0.1% and 10-year rates at 0% but announced that the allowable range of -0.5% and +0.5% around the ten-year target would now be seen “as references, not as rigid limits”. They also announced that they would buy 10-year bonds at 1.0% through fixed rate operations everyday moving forward. Most market participants viewed this as the BOJ raising rates without actually raising policy rates – a significant change from their historic ultra-loose monetary policy. Immediately following this decision, the Japanese Yen rallied to 138.8 against the U.S. Dollar vs. the previous week’s JPY of 141. 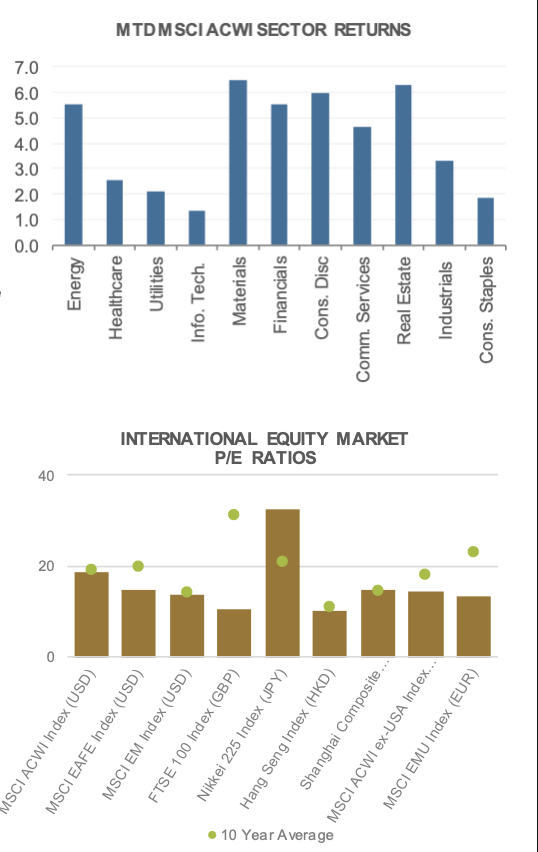
The whipsawing effect remained in China with the MSCI China Index returning +10.3% (in USD terms). Chinese equities rallied on the news that Beijing would provide more stimulus to support the economy following weaker than expected PMI prints. China’s manufacturing purchasing managers index (PMI) moved slightly higher to 49.3 in July from 49.0 in June, still below the 50 level that separates a contraction vs. expansion. Non-manufacturing PMI fell to 51.5 in July from 53.2 in June, marking the lowest reading for the non-manufacturing sector this year. Both numbers spotlight the fact that the Chinese economy has struggled to revive growth coming out of pandemic related lockdowns. Year-to-date, China still lags most other Developed & Emerging Market countries.
At the international sector level, Materials (+6.5%), Real Estate (+6.3%), Consumer Discretionary (+6.0%) and Financials (+5.5%) led the way while Information Technology (+1.4%), Consumer Staples (+1.9%) and Utilities (+2.1%) were the laggards.
The Federal Reserve raised rates by another 25 basis points at their July meeting. Fed Chair Jerome Powell emphasized that going forward, the Fed would be looking at the data and deciding what to do based on that information. There was an expectation that only every other meeting would be “live,” meaning that rates could potentially increase. Powell was very clear in his rebuttal of that assumption, saying that every Fed meeting is “live,” and interest rates will continue to be adjusted as the Fed deems prudent.
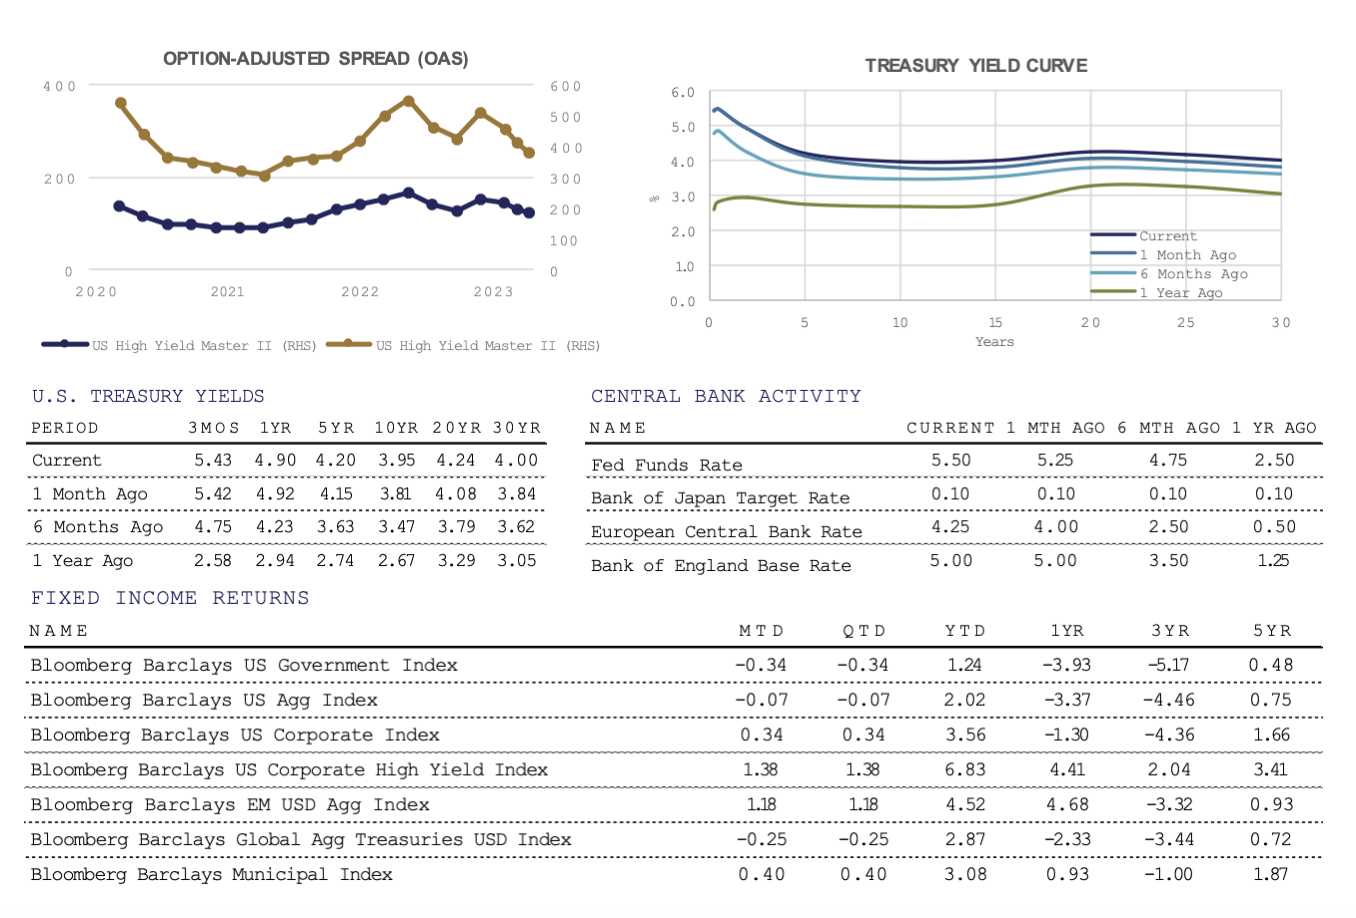
In the month of July, the yield curve shifted slightly higher inside of 12 months, stayed steady from 2 years to 5 years, and moved higher further out the curve. This shift higher in yields pressured returns, with the highest quality bonds posting negative returns. However, Investment Grade (IG) and High Yield (HY) corporate bonds were able to post positive returns due to the additional yield that they provide outweighing the negative price pressure of higher interest rates.
Government bond returns were slightly negative in July, caused by the move in interest rates. The Aggregate (AGG) return was roughly flat, with the negative return from higher quality bonds counterbalanced by the positive returns from the corporate bond market.
Credit spread tightening was experienced in the Investment Grade and High Yield markets during the month. This means that the market required less additional yield (spread) over what Treasury bonds are offering to entice bond investors to purchase corporate bonds in stead of Treasuries. This yield spread is influenced by market sentiment. When the market is very optimistic, the amount of additional yield needed to get investors to move into riskier positions declines, and as we can see in equity market returns, optimism is growing.
Tax-free Municipal bonds continued their strong 2023 performance in July. While their prices have held up, boosting returns, they have become less attractive on a relative basis. This is because tax-free yields have not risen as quickly as taxable bonds have. Over time, Muni bond yields do tend to follow taxable yields, but as with monetary policy, there can be long and variable lags. Income tax policy also affects the relative yields of Municipal bonds.
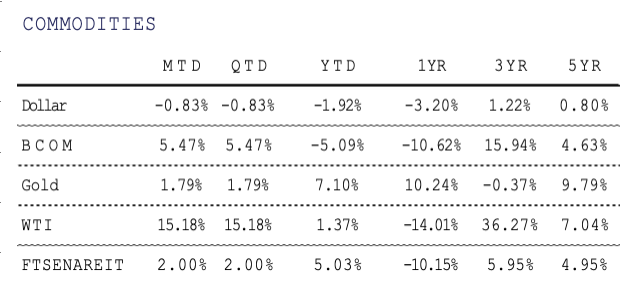
Alternative investments had mainly positive returns in July, as the “risk-on” market environment continued. Broad commodities, as measured by the Bloomberg Commodity Index, rose +5.5% for the month. In addition to the general economic news affecting the rest of financial markets, record heat, extreme weather events, and the Russia-Ukraine War are all playing a factor in global commodity prices.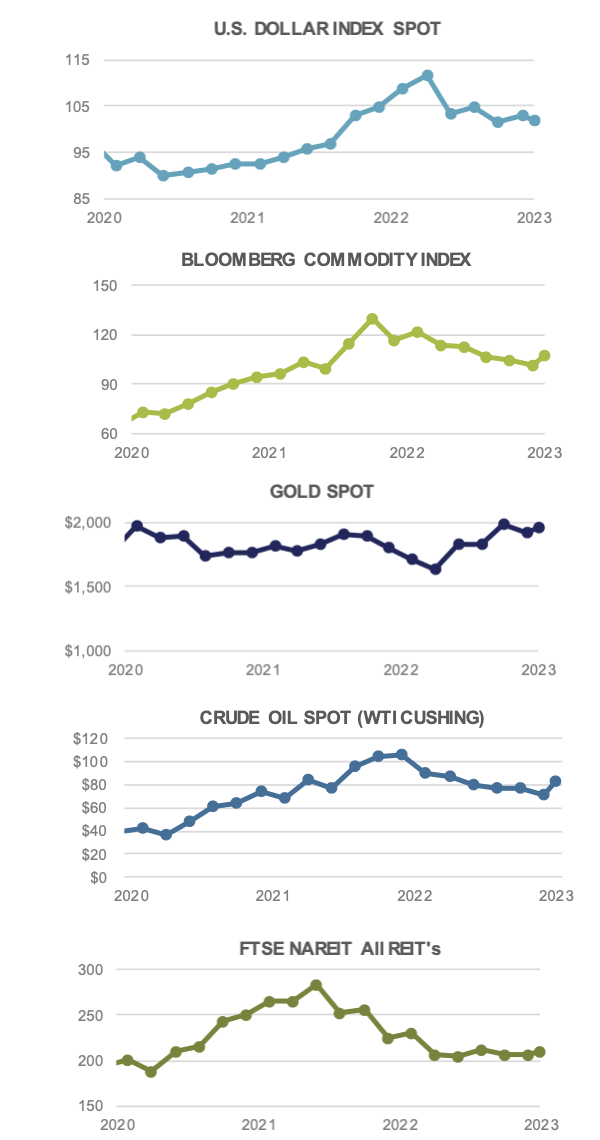
Oil prices spiked in July, with WTI Crude Oil rising +15.2% during the month to close at $81.80 a barrel, its highest level since April. Oil demand remains strong while supply is lower after OPEC+ has been cutting production in recent months to keep the market tight.
Although many parts of the United States faced record heat over the past month, natural gas prices have remained relatively range bound. Americans are burning a large amount of natural gas in order to generateelectricity to keep cool, but abundant supplies have kept the cost from soaring. Warmer than usual weather this past winter, which left a lot of natural gas unburned, and strong renewable electricity generation has helped alleviate the demand.
In mid-July, Russia withdrew from the U.N. backed grain deal which had allowed Ukraine to export grain to the rest of the world for the past year. Russia most likely refused to renew the deal as a way to prop up commodity prices, as they are a major grain producer themselves, while also harming Ukraine’s economy. Ukraine, often referred to as the breadbasket of Europe, will no longer be able to ship grains as easily through the Black Sea and some agricultural commodity prices initially spiked in response. This news combined with hotter than normal temperatures across much of the Northern Hemisphere, has led global food prices into a period of flux after moderating over much of the past year.
For more news, information, and analysis, visit the ETF Strategist Channel.
