
Economic Overview
Economic data, particularly around employment, remain robust. Inflation, while steady, is still above the Fed’s target rate of 2%, and US GDP for Q4 shows the economy growing at a 3.2% annual rate. The Atlanta Fed GDP Now Forecast suggests 3% annualized growth for the first quarter.
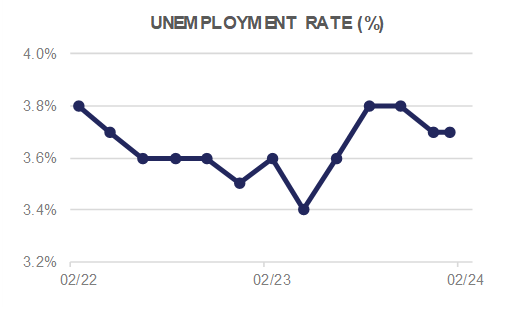
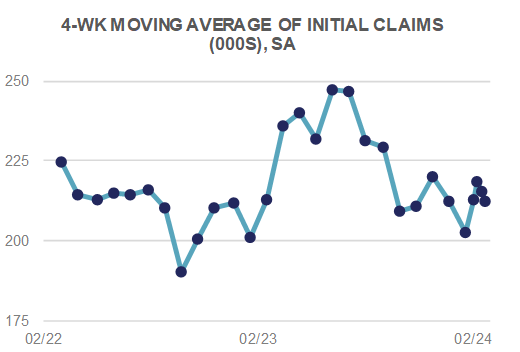
The Unemployment Rate in January held steady at 3.7%, although Nonfarm Payrolls surged by 353k (versus expectations for +185k). The JOLTS reading for December ticked back up over 9 million openings, and weekly Initial Jobless Claims have yet to break meaningfully higher. In sum, the U.S. employment picture remains strong, and is the backbone of the “no-landing” thesis.
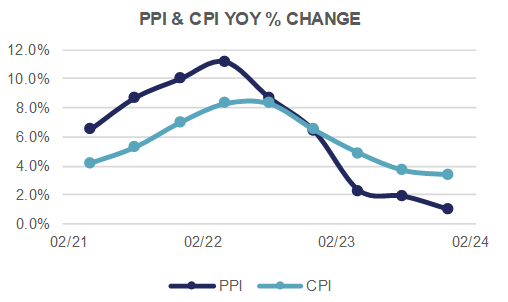
Inflation could prove more nettlesome, however, as it may prevent the Fed from cutting short-term rates in 2024, which would likely prove unsettling to equity markets. The Fed’s preferred inflation measure, the Personal Consumption Expenditure (PCE) Deflator, rose +0.3% in January, and is up +2.4% YoY. The Core PCE, which strips out volatile food and energy prices, rose +0.4% MoM, and is up +2.8% YoY. These numbers remain above the Fed’s target of 2% inflation, and may serve to delay interest rate cuts.
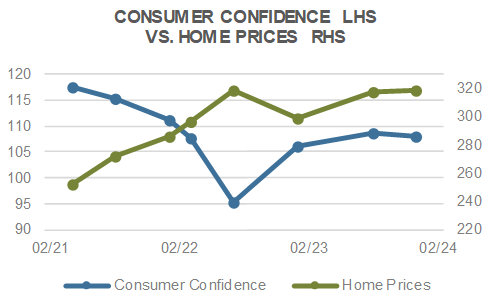
The outlook for the US economy remains strong, despite increasing geopolitical unrest and election-year angst. Corporate earnings rose YoY in Q4, the demand for labor is high, the housing market is strong, and thus far, higher interest rates haven’t triggered widespread distress. As mentioned up top, a lot rests on the Fed this year, with cuts to Fed Funds providing a risk tail-wind, but a more hawkish Fed potentially disrupting this Goldilocks situation we find ourselves in.
Domestic Equity
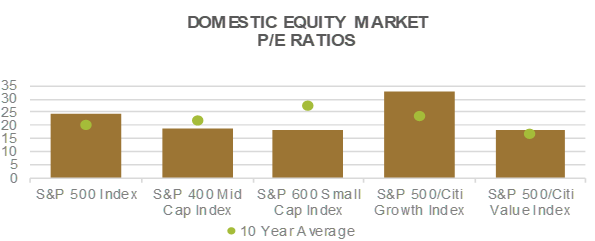
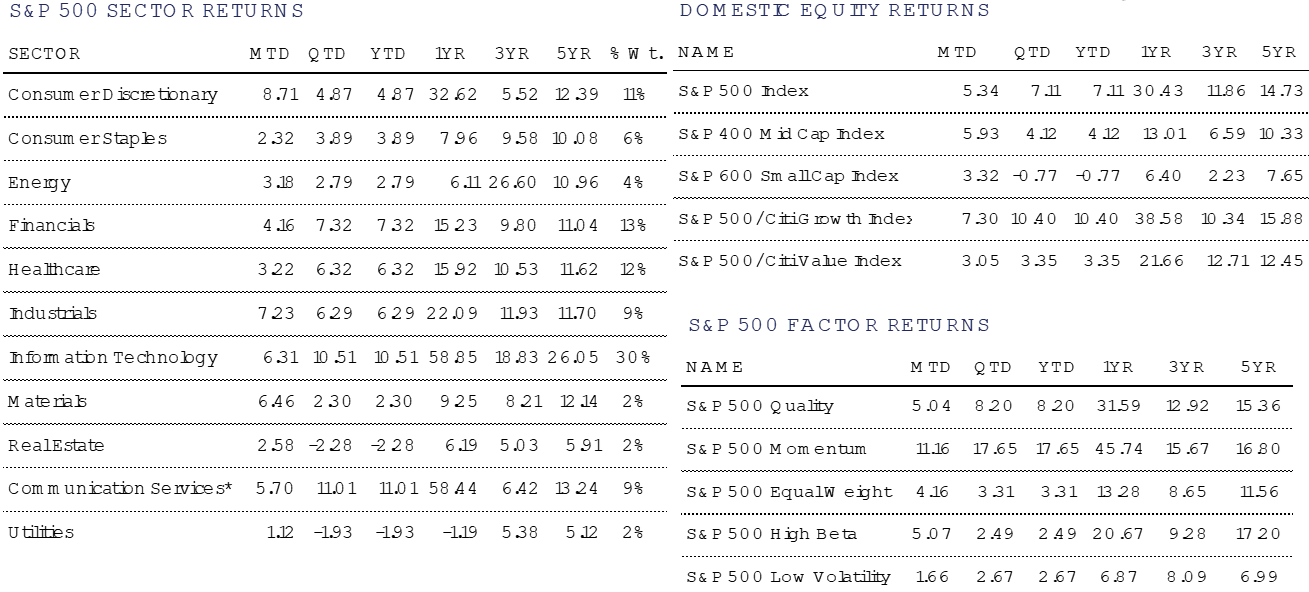
U.S. equities rose sharply in February with the benchmark S&P 500 Index gaining +5.3% to close at another all-time high of 5,096. Mid-Caps, as measured by the S&P 400 Index, rose an even more impressive +5.9% on the month, helped by its cyclical sector composition. Small-Caps, as measured by the S&P 600 Index gained a still impressive +3.3%, but lagged the broader market.
Performance through February continues to be concentrated at the top of the market. The S&P Top 50 Index has gained an impressive +9.6% YTD, outperforming the other 450 companies in the S&P 500. Large-Caps are quickly up +7.1%, adding to last year’s more than +26% gain; however, the “average” stock continues to lag the broader market, with the S&P 500 Equal Weight Index gaining only +3.3% on the year.
From a style factor perspective, Growth once again outperformed Value, with the S&P 500 Growth Index rising +7.3%, where as the S&P 500 Value index gained a mere +3.1%. For the year, the delta between the two stands at +705bps in favor of Growth, thanks to the continued dominance of Artificial Intelligence (AI) related themes. Looking at the S&P 500 Momentum Index, which gained +11.2% on the month, and is up an impressive +17.7% YTD, it can be seen that companies outside of AI are popping up on momentum screens in the new year. Furthermore, the momentum scores that weight the index no longer favor many of the “Magnificent 7” names from last year. Only Meta and NVIDIA are representing the Magnificent 7 within the Top 10 holdings of the Index. In fact, they are the only two Magnificent 7 stocks within the entire Momentum Index. Put differently, AI as a theme appears to be broadening out, and performance is finally coming from other parts of the market.
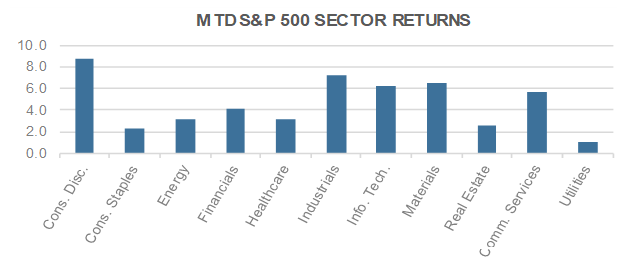
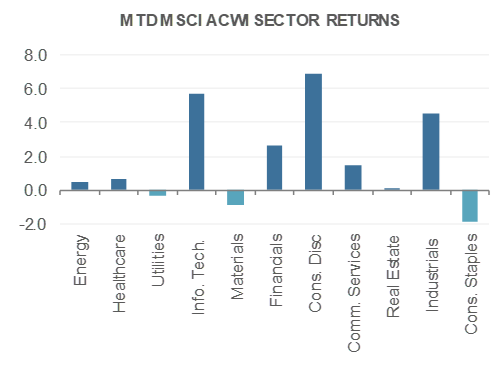
From a sector standpoint, Consumer Discretionary led the pack in February, gaining +8.7%, followed closely by Industrials and Materials, which rose +7.2%, and +6.5%, respectively. Industrials and Materials continue to benefit from a strong US economy and continued fiscal stimulus from the Inflation Reduction Act, CHIPS Act, and Infrastructure bill that should serve as tailwinds for years to come.
Lastly, it should be noted that Communication Services (+11.0%) and Information Technology (+10.5%) are the best performing sectors YTD by more than +300bps when compared to the next sector, highlighting that fact the best performing parts of the market have both a growth and momentum tilt, and can likely be found within those two sectors (Meta and NVIDIA anyone?).
International Equity
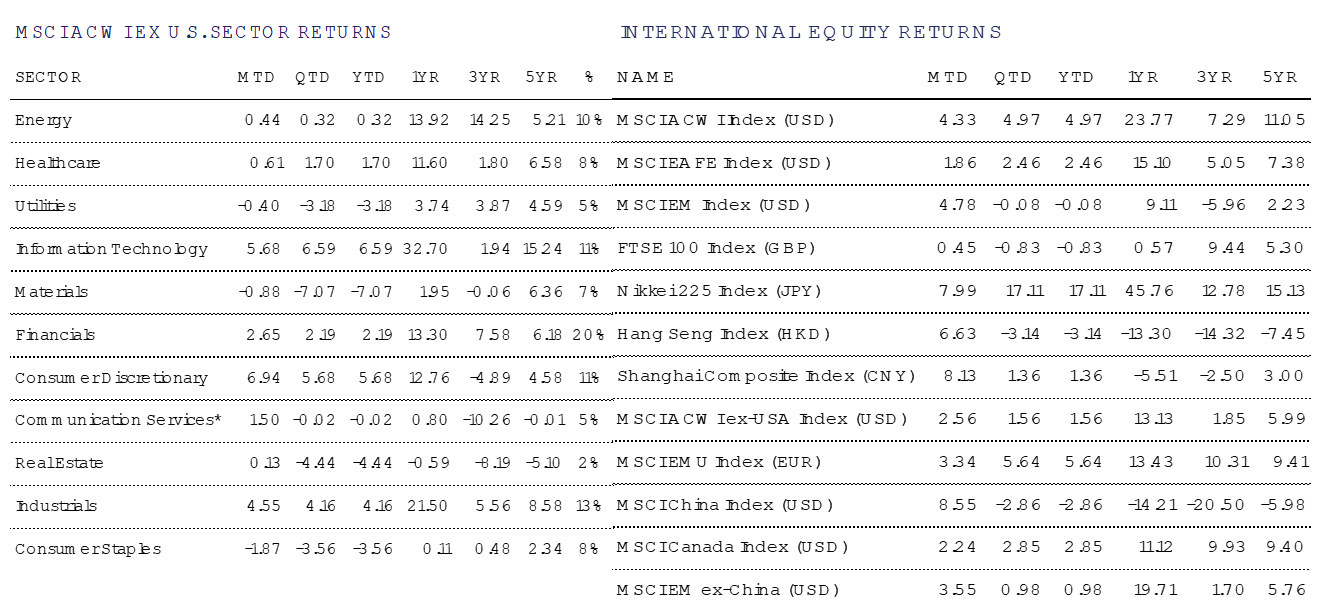
International risk assets saw positive performance during the month of February. Developed Markets (DM), as measured by the MSCI EAFA index, returned +1.9% during the month while Emerging Markets (EM), as measured by the MSCI EM Index gained +4.8% (both in USD). The risk-on sentiment felt internationally was mainly driven by a slew of positive economic data coming from many major global economies.
The Eurozone Composite Purchasing Managers Index showed an increase in February to 48.9 from January’s number of 47.9 – possibly an early indication that the Eurozone’s economy may be beginning to stabilize. While a number below 50 indicates economic contraction, it is notable that the trend in this area has been increasing. The MSCI EMU Index extended its January gains, up +3.3% during the month (in EUR). While performance was positive, only 8 out of the 16 countries contributed positively to the pan-European equity returns.
Japan saw a continued rally in their markets, with the Nikkei 225 again reaching new all-time highs and returning +8.0% over the month (in JPY). The performance out of Japan continues to be supported by strong economic data. Exports increased +11.9% in January and the Services sector PMI for February came in at 52.5. While manufacturing PMI softened to 47.2, down from 48.0 in January, this decrease didn’t seem to be enough to worry market participants. Comments from Bank of Japan Governor Kuzuo Ueda reiterated that the country’s accelerated inflation was keeping up with the rise in wages, supporting their conviction for ending negative interest rates. Market participants seemed to take these comments in stride, boosting overall returns in the area.
China saw positive news for the first time in what feels like a very long time as tourism revenue over the weeklong Lunar New Year surged by +47.3% year over year, and surpassed pre-COVID levels. However, average spending per person over the holiday fell -9.5% from 2019, putting a damper on the headline number. The people’s Bank of China took an accommodative stance over the month, decreasing the five-year loan prime rate by 25 basis points to 3.95%. Overall, it seems as if investors took whatever good news they could find in stride, as the MSCI China Index rebounded from January, returning +8.6% during the month.
Fixed Income
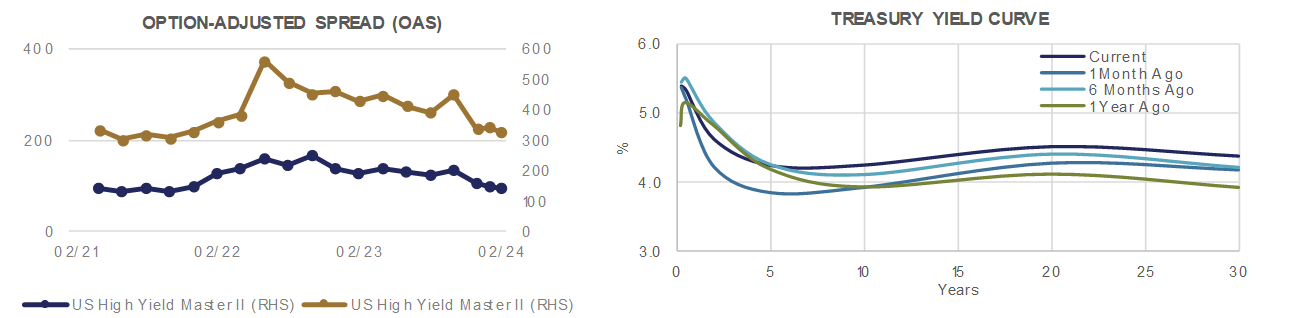
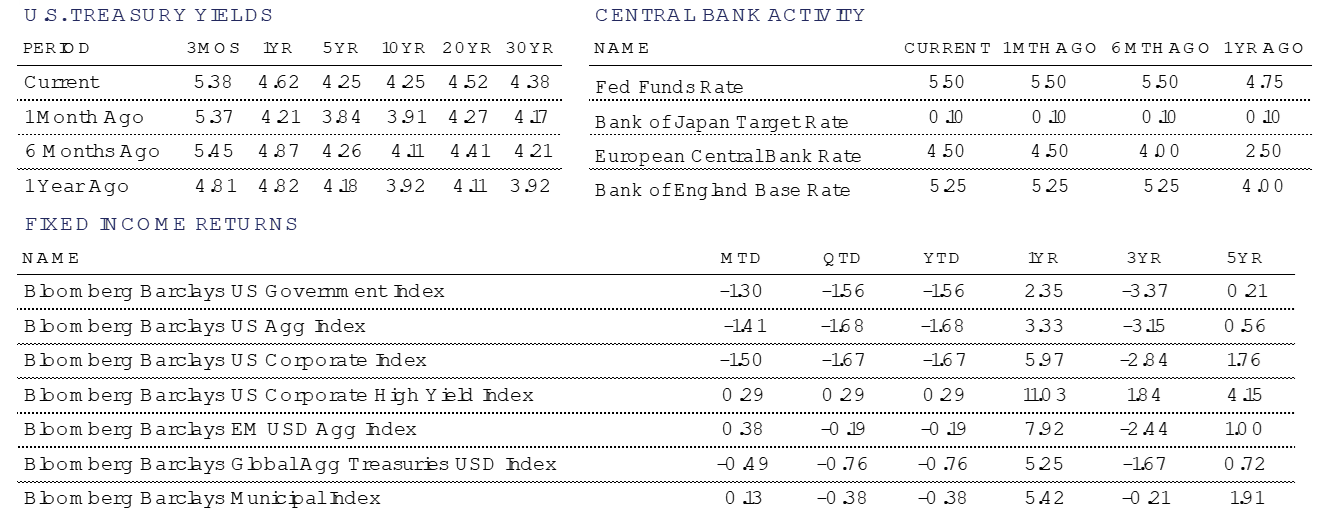
The most recent inflation data releases have come in a bit hotter than the market anticipated, reducing the number of expected rate cuts being priced into the market.
This caused yields to shift broadly higher during the month of February, as the “Fed Pivot” euphoria gave way to a re-embrace of “Higher for Longer.” At one point, the market was pricing in upwards of 7 rates cuts in 2024. This has been cut roughly in half, closer to what the Federal Reserve projections would imply.
Without a strong expectation of significantly lower rates, the tailwind for certain assets becomes less clear. Banks with significant amounts of unrecognized losses in their investment portfolios (caused by rising rates) remain constrained, and their loans backed by commercial real estate (CRE) remain under pressure as higher rates and declining occupancy levels pressure the value of the collateral.
As rates have moved higher, longer Duration bonds have underperformed. In the month, Investment Grade (IG) corporate bonds were the most challenged, posting a loss of -1.5%. This loss came despite BBB credit spreads remaining relatively steady and single A spreads actually contracting, which affect bond prices positively.
High Yield (non-investment grade) corporate bonds had a strong month, returning +0.3% despite rising yields. This is due to their higher income generation, coupled with contracting credit spreads and a Duration roughly 50% lower than the Investment Grade corporate bond benchmark, limiting the negative impact of rising rates.
Tax-free Municipal bonds were also a strong performer in February. For some time, shorter maturity municipal bonds have looked expensive, and still do. There was value to be found in longer Duration tax-free bonds, making a barbell structure using taxable bonds for shorter maturities and tax-free bonds for longer maturities an attractive portfolio structure. Recently, it has become more difficult to find good value in tax-free bonds, even at the long end of the curve. Municipal bonds have held up admirably in this rising rate environment, but offer less value now for investors who can entertain other options.
Alternative Investments
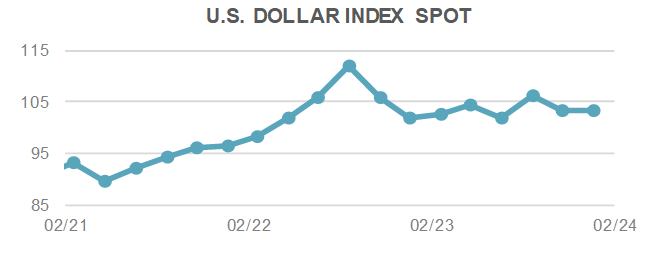
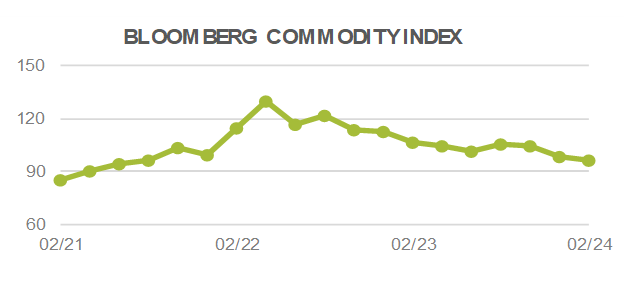
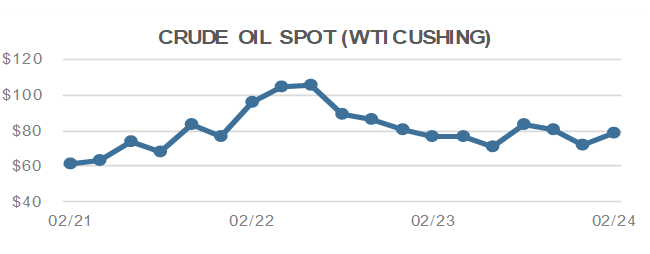
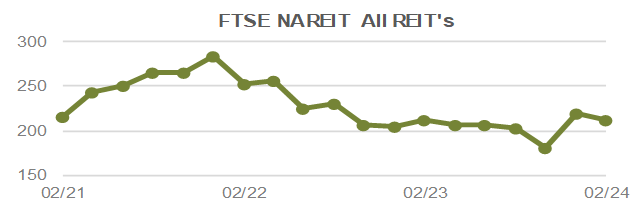
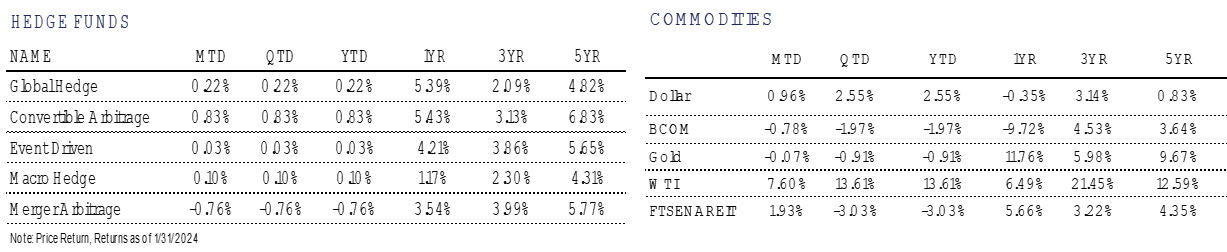
Alternative investments had mixed results in February. Broad commodities, as measured by the Bloomberg Commodity Index, returned -0.8% for the month. Commodity prices were partially dragged down by a stronger U.S. Dollar, as the DXY Index was up +1.0% during the period. A large gain in WTI Crude Oil prices (+7.6%) helped offset some of the weakness in other underlying commodities.
Broad commodities are in a relatively subdued market currently, at least compared to the volatility experienced in 2022. However, there is an elevated amount of political risk in 2024 given the conflicts in the Middle East and Ukraine. These conflicts combined with a significant amount of national elections throughout the world this year leave an uncertain backdrop that could introduce more volatility at any moment.
The past few years has seen some structural shifts in financial markets, including private market alternative investments growing in size and accessibility. This includes the private debt market, which now has a greater overall market cap than the publicly traded U.S. High Yield bond market. Many financial institutions stepped back from the lending business in 2023 after the Silicon Valley Bank scare, allowing private credit to step in to finance middle market companies looking for funding. Private credit assets grew to over $1.6 Trillion globally in 2023 and are projected to reach $3.5 Trillion by 2028, according to BlackRock. However, the growth has recently caught the eyes of some regulators in a space where valuations and pricing aren’t as transparent.


For more news, information, and analysis, visit the ETF Strategist Channel.
