
By RiverFront Investment Group
A LESSON FROM FORMULA ONE RACING
As a Formula 1 racing fan, I find myself comparing the 2019 action in the equity markets to that of a Grand Prix race with all the thrills and tension that come along with it. The drivers must have endurance, possess the ability to navigate hairpin turns as well as the straightaways and maintain constant contact with the crew to reaffirm conditions and strategy. Sound familiar? As important as all the internal team dynamics are, invariably there are external variables – the course, the weather, and the actions of other racers – over which the team has no control.
THE START: It would have been difficult to have called the start of 2019. The dramatic downside reaction that ended 2018, sparked by fears of tighter interest rates, was quickly shrugged off as the Federal Reserve reversed course and indicated that it would proceed cautiously in determining further rate hikes. That coupled with what was perceived as positive news on the trade front resulted in a first quarter rebound in US equities that was at the high end of our optimistic forecast for the entire year in our 2019 Outlook.
THE CHICANE: A chicane is a sequence of tight corners (think zig-zag) in alternate directions built into the racing circuit to slow the cars. The “chicane,” for purposes of this reference, comes in the form of the reality of where we are in the earnings cycle. Earnings for the S&P 500 came in considerably better than the 4% decline that was originally forecast for the first quarter, however, according to FactSet they were still slightly negative. It is estimated that the decline was -0.4%. Earnings for the second quarter are now forecast to decline by more than 2%, which would likely reignite the worries about the impact of an earnings recession. S&P 500 earnings revision ‘momentum’ – a moving average of the total number of earnings-per-share (EPS) estimates revised up by analysts over the past 100 days, minus the number revised down, divided by total number of estimates – has recovered from its dramatic drop earlier this year, but is still hovering around zero, suggesting to us a lack of a decisive positive view by analysts heading into earnings season (see chart, next page).
Earnings growth leads to valuation multiple expansion, so the change in the rate of change for that growth is impactful to the valuation levels of the market. At this juncture, investors must look ahead to the back half of 2019 and into early 2020 to see earnings growth reaccelerate. On a forward multiple, the S&P 500 is at approximately a 16.7x multiple on 2019 earnings which is above the 10-year average of 14.8x. An article from Bloomberg earlier this week noted the growing number of Wall Street analysts who have cut their earnings estimates for the S&P, yet none have cut their target price for the index. As we head into earnings reporting season in a few weeks, the actual data as well as the guidance will be an important component in determining whether we see valuation multiple expansion or contraction from current levels.
THE YELLOW FLAG: A yellow flag signifies that there is hazard ahead. Given market valuations, we believe the “yellow flags” that we have seen in terms of macroeconomic and geopolitical hazards should have created more volatility, particularly to the downside, than what we have experienced. The sharp selloff in May that was the result of news that the US would proceed with tariff increases on imports from China seems to have become a dim memory in anticipation of progress as investors look ahead to the upcoming G20 meeting.
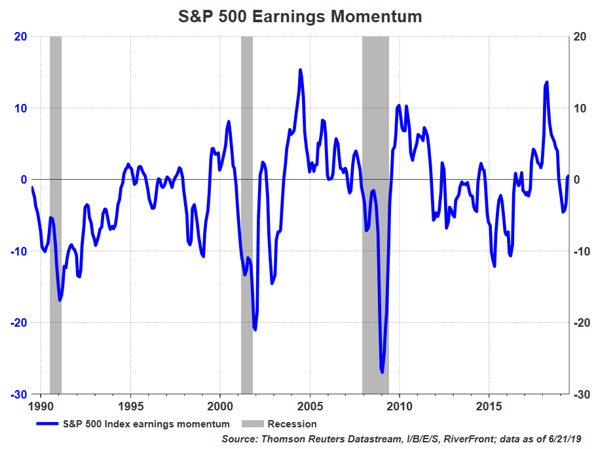
Past performance is no guarantee of future results. Shown for illustrative purposes only. You cannot invest directly in an index.
Ironically, there has been no concrete evidence of any substantive agreement between the two countries, so hope seems to be the prevailing strategy. Meanwhile, estimates for the potential impact that higher tariffs could have to US GDP have started to tick higher. Headlines are appearing daily regarding the negative impact to businesses and consumers as the imposition of these tariffs loom. In early June, consumer sentiment did tick slightly lower in the most recent Michigan Consumer Sentiment Survey due to tariff concerns; however, it remains at record levels. There are some signs of slowing in the US economy such US manufacturing data, and a recent survey of US CEOs revealed that sales expectations, plans for capital investment and hiring have all dropped.
THE STRAIGHTAWAY: As we wind down the second quarter it feels like we are on a straightaway. US equity markets have reached record highs, central banks around the world have tilted more dovish, and investors seemed to have reconciled that slower growth is a reality. At RiverFront, we have adjusted portfolios based on our underlying fundamental underpinnings of asset allocation, tactical adjustments, security selection and risk management to account for these variables.
Currently, our shorter-horizon strategies are considered neutral risk relative to our benchmarks, with a tilt towards US equities. This reflects both our optimistic views around US central bank policy and long-term preference for stocks over bonds, balanced with the uncertainty surrounding tactical factors like trade headlines. The longer-horizon strategies, where investors inherently may possess a higher tolerance for short-term uncertainty, remain positioned in a “risk on” fashion and also reflect a preference for US equities.
This article was written by the team at RiverFront Investment Group, a participant in the ETF Strategist Channel.
Important Disclosure Information
The comments above refer generally to financial markets and not RiverFront portfolios or any related performance. Past results are no guarantee of future results and no representation is made that a client will or is likely to achieve positive returns, avoid losses, or experience returns similar to those shown or experienced in the past.
Information or data shown or used in this material is for illustrative purposes only and was received from sources believed to be reliable, but accuracy is not guaranteed.
In a rising interest rate environment, the value of fixed-income securities generally declines.
It is not possible to invest directly in an index.
When referring to being “overweight” or “underweight” relative to a market or asset class, RiverFront is referring to our current portfolios’ weightings compared with the portfolios’ composite benchmarks. For more information on our composite benchmarks, please visit our website: www.riverfrontig.com.
Technical analysis is based on the study of historical price movements and past trend patterns. There are no assurances that movements or trends can or will be duplicated in the future.
Investing in foreign companies poses additional risks since political and economic events unique to a country or region may affect those markets and their issuers. In addition to such general international risks, the portfolio may also be exposed to currency fluctuation risks and emerging markets risks as described further below.
Changes in the value of foreign currencies compared to the U.S. dollar may affect (positively or negatively) the value of the portfolio’s investments. Such currency movements may occur separately from, and/or in response to, events that do not otherwise affect the value of the security in the issuer’s home country. Also, the value of the portfolio may be influenced by currency exchange control regulations. The currencies of emerging market countries may experience significant declines against the U.S. dollar, and devaluation may occur subsequent to investments in these currencies by the portfolio.
Foreign investments, especially investments in emerging markets, can be riskier and more volatile than investments in the U.S. and are considered speculative and subject to heightened risks in addition to the general risks of investing in non-U.S. securities. Also, inflation and rapid fluctuations in inflation rates have had, and may continue to have, negative effects on the economies and securities markets of certain emerging market countries.
Stocks represent partial ownership of a corporation. If the corporation does well, its value increases, and investors share in the appreciation. However, if it goes bankrupt, or performs poorly, investors can lose their entire initial investment (i.e., the stock price can go to zero). Bonds represent a loan made by an investor to a corporation or government. As such, the investor gets a guaranteed interest rate for a specific period of time and expects to get their original investment back at the end of that time period, along with the interest earned. Investment risk is repayment of the principal (amount invested). In the event of a bankruptcy or other corporate disruption, bonds are senior to stocks. Investors should be aware of these differences prior to investing.
Standard & Poor’s (S&P) 500 Index measures the performance of 500 large cap stocks, which together represent about 80% of the total US equities market.
RiverFront Investment Group, LLC, is an investment adviser registered with the Securities Exchange Commission under the Investment Advisers Act of 1940. Registration as an investment adviser does not imply any level of skill or expertise. The company manages a variety of portfolios utilizing stocks, bonds, and exchange-traded funds (ETFs). RiverFront also serves as sub-advisor to a series of mutual funds and ETFs. Opinions expressed are current as of the date shown and are subject to change. They are not intended as investment recommendations.
RiverFront is owned primarily by its employees through RiverFront Investment Holding Group, LLC, the holding company for RiverFront. Baird Financial Corporation (BFC) is a minority owner of RiverFront Investment Holding Group, LLC and therefore an indirect owner of RiverFront. BFC is the parent company of Robert W. Baird & Co. Incorporated (“Baird”), a registered broker/dealer and investment adviser.
Copyright ©2019 RiverFront Investment Group. All Rights Reserved. 882653
