
Year in Review
► The U.S. economy substantially exceeded expectations in 2023. Real Gross Domestic Product (GDP) likely grew in excess of 2.5% for the full year and was better in the second half than the first. This coincided with headline Consumer Price Index (CPI) falling from 6.5% to 3.1% and virtually no increase in unemployment, in the face of widespread calls for recessions.[1]
► China’s economy surprisingly contracted[2] despite the lifting of all Covid restrictions due to a burst property bubble and the ensuing lack of consumer confidence.
► For much of the year markets wrestled with generally improving inflation trends but a seemingly stubborn Federal Reserve who were determined to send rates higher than the data implied was necessary. This changed in the fourth quarter as the Federal Reserve changed its own projection for future interest rates, implying three rate cuts in 2024. The market has taken this and run with it, anticipating six rate cuts in the forward curve and substantially re-pricing all interest sensitive assets rapidly in the last two months of the year.
► While we are cautious that this re-pricing may not sufficiently discount potential downside scenarios, we do believe that this shift in sentiment has put inflation concerns on the backburner and brought growth as the predominant risk to markets in 2024.
► With investors focusing on growth rather than inflation, we think fixed income will reclaim its traditional role in portfolios as a useful hedge against weaker economic growth and a way to express “risk-off” sentiment.
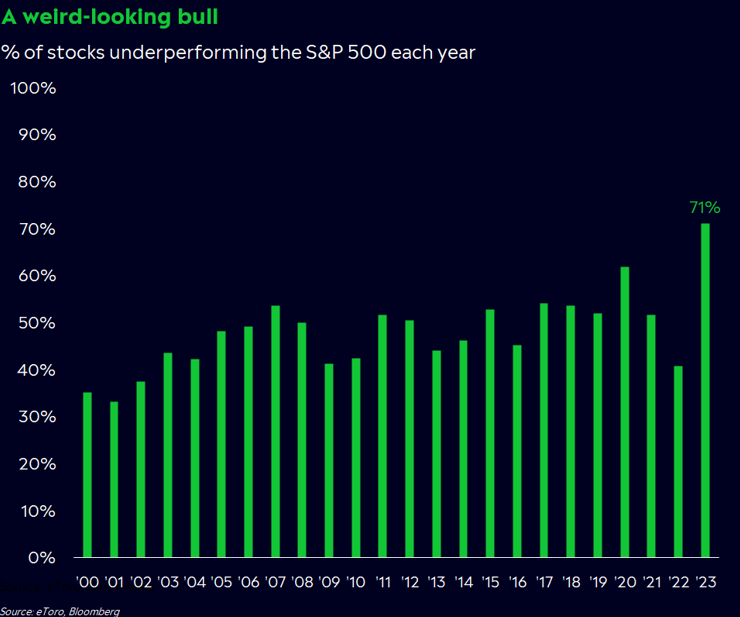
► Our quantitative systems were generally able to find the most attractive securities within their investment universe during the year, but the equity markets’ extremely narrow leadership made outperformance relative to cap-weighted indices historically difficult.
► Our portfolios had their lowest ever realized trading frequency in 2023. This was due in some part to continued improvement of our portfolio implementation, specifically avoiding less impactful trades, but is also a reflection of the historically narrow market. The “perfect knowledge” portfolio, the one you’d make with perfect hindsight to select the top performing Exchange Traded Funds (ETFs) from the investment universe, would have had the lowest turnover since our strategies’ inception.[3]
► Entering the year, we are positioned near our neutral asset allocations with a bias towards U.S. growth, but we see new securities moving up on the periphery in the rankings that may soon enter the portfolios. We expect more opportunities from our expanded investment pool to emerge if market leadership changes in 2024.
[1] Real GDP estimate based on 3 reported quarters and Atlanta Fed GDP now estimate for Q4 Real GDP growth. CPI data from BLS (Bureau for Labor Statistics) for 12/31/2022 through 11/30/2023
[2] Based on China total imports and exports declining in 2023 (Source: Bloomberg, China Total Trade 12/31/2021 – 12/31/2023) and minimal evidence of any economic growth.
[3] Internal estimates (Beaumont Capital Management, Algorithmic Inevstment Models) for the best performing portfolio within our pool of ETFs available on each date with a 25-day trading window from 12/31/2011 to 12/31/2023.
Source: eToto, Bloomberg
Correct Predictions
► We opened our 4Q 2022 letter proposing that a painful 2022 set up for a better 2023 as many excesses had been stomped out, and companies were forced to rationalize against far less lenient capital market conditions. In the end, both equities and the economy performed better than we had expected. The strong returns for equities were not evenly distributed though. For most of the year, market leadership was extremely narrow with a select few of the largest companies dominating market returns.
► We believed inflation would prove to be mostly transitory, and that now looks to be correct with even the inflation-obsessed federal reserve beginning to acknowledge as much.
► We believed that Central bankers were likely to “break” something with their historically rapid rate increases and that Banks balance sheets had become at risk due to the losses they were sitting on from fixed income assets on their balance sheets. These risks combined to create the regional banking crises in March.
► A major part of our optimism was the idea that technological innovation would drive growth citing some medical advancements such as the GLP1 obesity drugs and consumer-facing AI applications. These ended up being two of the dominant market narratives in 2024.
► We likened electric vehicles to the internet bubble and, for the most part, this bubble has burst. Although the secular growth of electric vehicles is undeniable, investors saw a wave of price cuts from the largest incumbent and were reminded that electric vehicles are still a highly discretionary consumer good. In general, the difficult capital markets environment stalled out many “green projects” which were much easier to fund in the zero-interest rate regime.
Incorrect Predictions
► We likened central bankers to impatient doctors continuing to dose the economy with higher rates despite sparse effects and believed they would soon see the error of their ways and lower rates. It took them longer than we had expected, as perhaps they are just now getting comfortable with lower inflation and planning to cut rates sometime in 2024, despite inflation having been under control for some time.
► We expected the re-opening of China to be a major growth driver. Instead, China’s economy looks broken with high youth unemployment and a beleaguered property market combining to destroy consumer confidence and substantially weaken economic growth. It’s possible this is an underappreciated factor in the reduction of inflation in 2023.
► We expected the economy to deteriorate later in the year as the stimulus from government spending waned. This has yet to materialize, as consumers still have excess savings versus pre-covid trends. However, there are indications that at the lower-level consumer balance sheets are weakening.
► We expected declining asset values to drive opportunistic mergers and acquisitions, but this had not been the case until recently. Both the biotech and shale oil sectors have seen a large uptick which might foretell improvements elsewhere. This is a prediction we would not yet write off.
Biggest Surprises
1. The willingness of the market to reward companies in any way associated with Artificial Intelligence (AI).
► This played a major role in the emergence of the magnificent 7 as nearly all these companies are either directly or indirectly involved in AI. While many of these companies did see their businesses improve dramatically in 2023, much of their equity performance came from multiple expansion with the groups’ P/E ending the year at 33.6x.[4]
2. The willingness of investors to quickly return to some of the speculative businesses of the prior era.
► Although there are still seemingly no use cases for bitcoin outside of speculation, money-laundering, or facilitating spending/savings in third-world economies, the asset has returned to prominence. It is currently trading over $45,000 as of 1/9/2024—within reach of its prior bubble highs.
3. The weakness of the Chinese economy
[4] Based on our own calculations using Bloomberg data for the 7 largest companies in the S&P 500 from 12/31/2022 – 12/31/2023.
Positioning and Outlook
Portfolio Positioning
► Reflecting the poor market breadth, the average equity in our investment universe substantially underperformed market indices, returning roughly 15% while the S&P 500® Index returned 26.2% and the MSCI ACWI Index returned 22%.
► Our quantitative system identified some of the very best performing options within our entire investment universe of 230 ETFs: the Home Construction ETF (ITB) and the Semiconductors ETF (SOXX) were the two top performing ETFs in our entire investment universe, with general U.S. technology and growth rounding out much of the top, conversely the worst performing securities were generally in the Asia Pacific region which the strategies avoided. These picks allowed our portfolios to perform in-line or within a couple percentage points of our asset allocation benchmarks despite the substantial outperformance of market indices versus the average equity ETF in our pool.
► All three portfolios are close to their “neutral” or expected asset allocations. Despite lower levels of overall equity exposure, our equity beta was high in the rising market in the fourth quarter allowing our more aggressive portfolios to participate in the broad equity upside.
► Portfolio turnover declined substantially in 2023 due to a combination of continued improvement of our portfolio implementation process and lower volatility in our rankings.
► Portfolio positions are a combination of high momentum growth equities, many of which our system has favored for quite some time, as well as a few new positions such as India.
► If the low volatility we saw at the end of the year continues, we expect our systems to favor more equity but not necessarily the same equities that were in favor in 2023.
► We see a world that may be less dominated by just the largest U.S. companies as a major positive for relative performance potential.
General Outlook
As is often the case, our current outlook somewhat mirrors our own system’s positioning – relatively neutral. We see more risks than opportunities on the margin as asset values have run ahead of expected fundamental improvements.
There seems to be a bifurcation amongst U.S. consumers. Rapidly rising asset prices have created a positive wealth effect for those in the “ownership class” while less wealthy consumers are beginning to fund their consumption with more debt.[5] We never thought the Federal Reserve needed to raise the Federal Funds rate so quickly and dramatically. We believe future studies will reveal that much of the drop in inflation was due to mending the pandemic era disruptions to the global supply-chain and to the surprising weakness in the Chinese economy. A yield curve that rises from 3% towards 5% makes sense to us. We are uncertain that long rates can stay at 4% with the large refinancing needs of the U.S. government.
[5] The delinquency rate on credit cards now excess pre pandemic levels, Adobe Analytics reported a huge uptick in “buy-now-pay-later” usage of 42.5% yoy versus total spending up just 9.6% yoy. Buy-now-pay-later users are often subprime credits. Auto loan delinquency rates are now at the highest rate since 1996 per Fitch ratings.
More Risks Than Opportunities
Last year a major reason for our more bullish narrative was poor investor sentiment after a terrible year for asset prices. This year, investors appear pointed more in the other direction. The Fed pivot drove a staggering re-pricing of risk for any interest-rate sensitive assets. This market activity could prove correct if the economy continues to be strong in 2024 and inflation does not re-emerge in a meaningful way. However, any threat to this narrative could imply meaningful downside to risk assets.
Some of the major risks we see to this consensus that might emerge are:
► Refinancing risks finally impact businesses (the lagged effects of interest rate increases).[6]
► Draining of pandemic excess savings – growth slows and/or consumers become overextended.
► China’s weak economy re-emerges and spurs another round of inflation. The impact of China’s sputtering economy on global inflation in 2023 seems to be overlooked. China currently represents 15% of all U.S. imports and had negative inflation for much of 2023. Meanwhile, China’s lackluster growth after re-opening from Covid did not drive-up commodity prices as expected, also lessening inflation. In short, rather than juicing the world economy and inflation, China’s troubles have been a gift to the U.S. economy.
► AI fails to be productized effectively in the near-term, therefore driving substantial multiple compression amongst some of the largest tech giants.
► The highly volatile geopolitical environment combined with an election year and low overall confidence in Washington.
One persistent risk that remains is the unsustainability of the government’s finances, which are arguably in the worst shape ever and have been further exacerbated by the rise in interest rates. Concerns around government finances seemed to peak and subsequently abate towards the end of the year, but they may return as we approach the coming election cycle. If the U.S. were to lose foreign confidence and struggle to continue to raise capital to fund its deficits, there would likely need to be painful restrictive choices (lower spending or higher taxes) which would likely have a negative impact on overall economic growth.[7]
U.S. Equities Are Not Cheap and Are Highly Concentrated.
Within equities both profit margins and valuations are high relative to history. However, profit margins remain comfortably below prior peaks within almost every sector, implying overall earnings could be strong should the economy continue to hold up. At 19.6x forward earnings the S&P 500 doesn’t appear to be a bargain, but when excluding the “Magnificent 7” the “S&P 493” trades for a more normal 17.5x forward earnings. Mid and Small Caps are cheaper still at 14.6x and 14.1x, respectively.[8] Discounts of foreign equities to the U.S. are also historically wide.[9] Even though the Magnificent 7 companies were truly magnificent in 2023 and remain some of the world’s best businesses, we now sit on the most concentrated S&P 500 in modern history.
[6] Heretofore, homeowners and most corporations have been insulated from the Federal Reserve’s extraordinary rate hikes having opportunistically refinanced their mortgages and other debts during the Fed’s zero interest rate pandemic regime. However, corporate debt maturities/refinances are coming. These will increase interest expense and reduce earnings. Likewise, consumers will face 20% higher monthly rent or mortgage expenses if they (must) give up their below market mortgage situation.
[7] In 2023, the government spent $5000 more per person than it took in taxes, and in a strong economy. Total debt per person now exceeds $100,000 and will grow by over 5% per year unless restrictive actions are taken. The U.S.’s ratio of debt to GNP and budget deficit to GNP now are twice the maximum levels allowed by the European Monetary Union.
[8] Bloomberg, data for Magnificent 7 generated internally while data for the Mid and Small Caps are represented by Bloomberg expected earnings for the Mid-Cap 400 and S&P Small Cap 600 Indices.
[9] The ACWI Ex-US index trades at a 33.9% discount to the S&P 500, the largest deficit since at least 2003. In addition, every single international sector trades at a substantially larger discount to the U.S. than the 20-year average. Source: Bloomberg, JP Morgan Asset Management
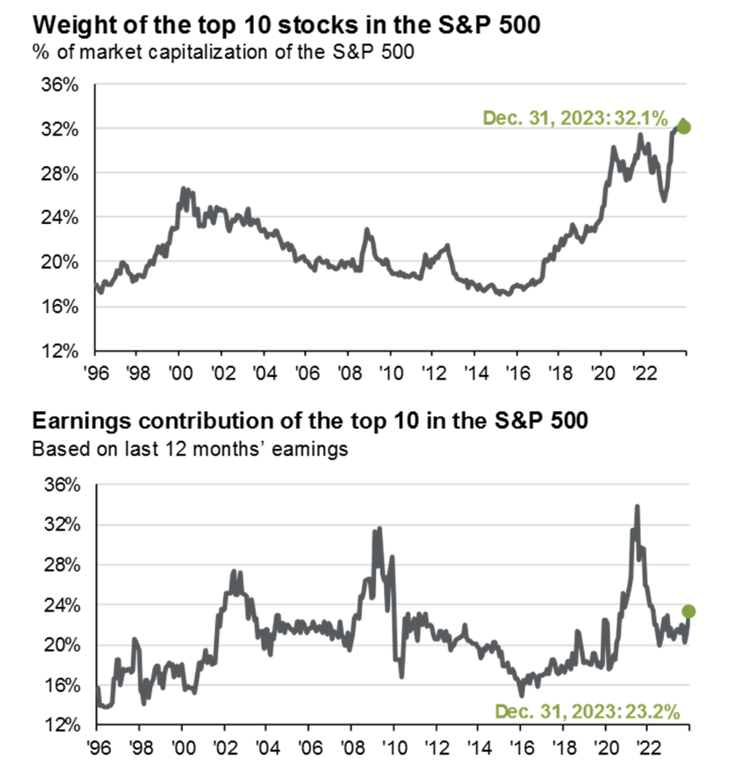
Source: FactSet, Standard & Poor’s, J.P. Morgan Asset Management. JP Morgan 1Q24 Guide to the Markets. The top 10 companies used for these two analyses are updated monthly and are based on the 10 largest index constituents at the beginning of each month.
We expect the best opportunities of 2024 to be outside of the largest U.S. companies. This could bode well for active management as it would mean more securities that outperform passive indices rather than less. We are well positioned to potentially capture this with our wide and recently expanded pool of investment options. Investors have had little incentive to deviate from the largest growth companies for many years and will likely take time to adjust should leadership change. A tactical strategy offers the opportunity to ride existing trends or quickly pivot as new trends emerge—something we expect will be even more impactful in the coming years.
Keep reading for our Bonus section: Exciting Trends and Themes
Written by the BCM Portfolio Managers
For more insights, visit blog.investbcm.com.
Exciting Trends and Themes
Homebuilders
Homebuilders had a fantastic year in what was a historically sluggish housing market. This is because homebuilders faced virtually no competition from existing home supply as homeowners were reluctant to trade in their valuable sub 4% mortgages. Lack of competing supply from existing homes combined with falling building costs as the year progressed created record gross margins despite high levels of discounting (typically via mortgage rate buy-downs) to help offset the higher cost of homeownership. With the 10-year treasury at 3.85% and the 30-year mortgage at 6.93%, the spread is historically anomalous, and we would expect mortgage rates to trend lower as 2024 progresses. At a certain level, lower rates present a risk to homebuilders as they would likely bring more existing supply online, but they also make homeownership more accessible for renters and should increase overall homeownership. A mortgage rate in the 5.5% to 6.5% range might prove to be the “sweet spot” for homebuilders. Although we are cautious, we still think the risk/reward for homebuilders is attractive given undemanding valuations, positive demographic tailwinds and some of the best balance sheets the group has ever had despite the risk of declines from all-time high margins as more supply potentially enters the market.
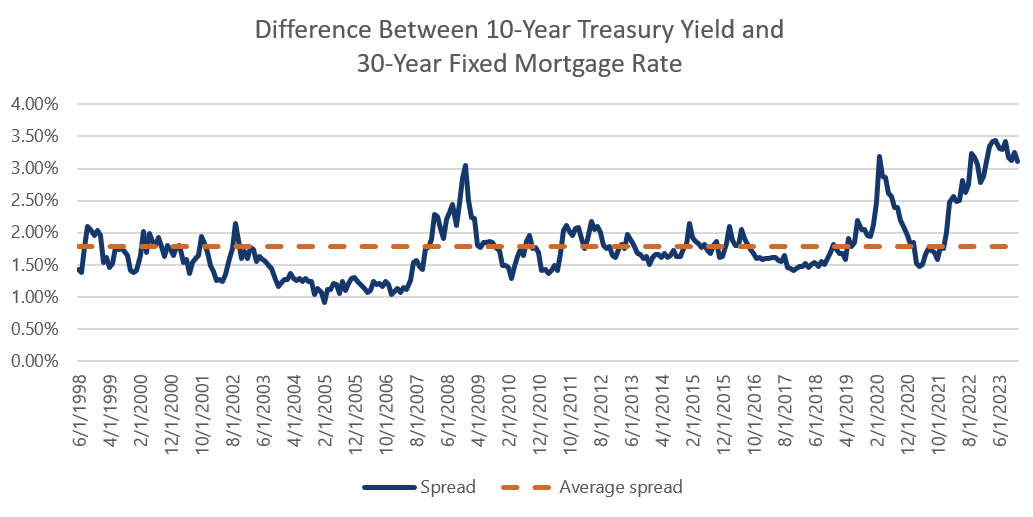
Source: Bloomberg, 10-year treasury yield as of 12/31/2023 and Bankrate.com 30-year fixed rate as of 12/31/2023
Semiconductors
Semiconductors were the most direct beneficiaries of the speculative AI boom we saw in 2023 as they are correctly perceived as selling the “picks and shovels” of the AI revolution. However, outside of this select use within data centers, it was generally a weak year for overall semiconductor growth. Consumer and industrial hardware still drive the majority of semiconductor volumes and these sectors did not fare well in 2023. While we believe there could be a resurgence of growth in many corners of the semiconductor market, we see risks to the market positions of some of the dominant semiconductor companies. The sector has become so important to the economy that governments have become incentivized to subsidize or promote domestic production as much as possible, potentially weakening the economics of incumbents. In addition, the buyers of AI-related chips are generally the largest and most advanced companies in the world who in many cases design their own chips. As time goes on, they may be further inclined to vertically integrate their businesses and squeeze some semiconductor businesses within their supply chains.
India
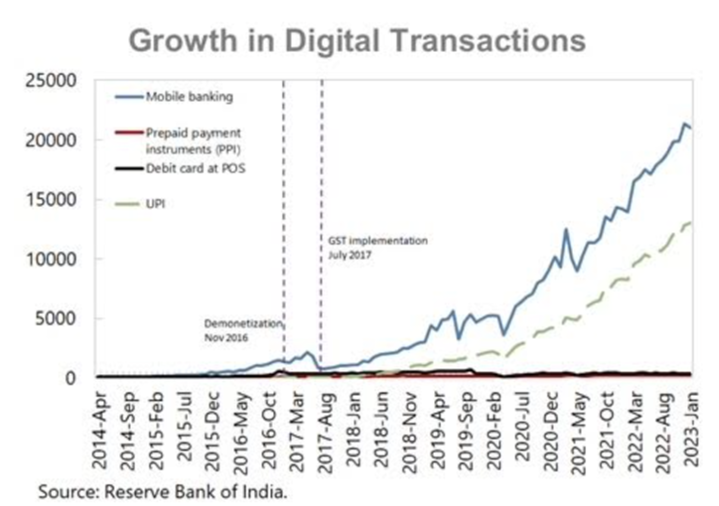
India’s economy offers attractive long-term growth prospects given its large population and strong demographics as well as its relatively low level of overall development. Western economies wanting to place less emphasis on China may give India the opportunity to capitalize. Like many emerging market economies, India has historically struggled with capital access, and its population has been severely underbanked versus the western world. A series of reforms over the past 10 to 15 years have successfully “digitized” India’s economy which has opened up capital availability (bank accounts, small business loans, etc.) to nearly the entire population. This digitization also allows the government to transfer capital more efficiently and broadly to the private sector. With a manageable level of debt to GDP (84%),[10] India should be able to drive additional growth from fiscal expansion in the coming years. If India can continue to keep its inflation rate under control, it may offer a similar opportunity that the Chinese economy provided investors in the early 2000s as it modernized its own economy from a similar level of GDP per capita to its current level which is roughly 4x that of India.[11]
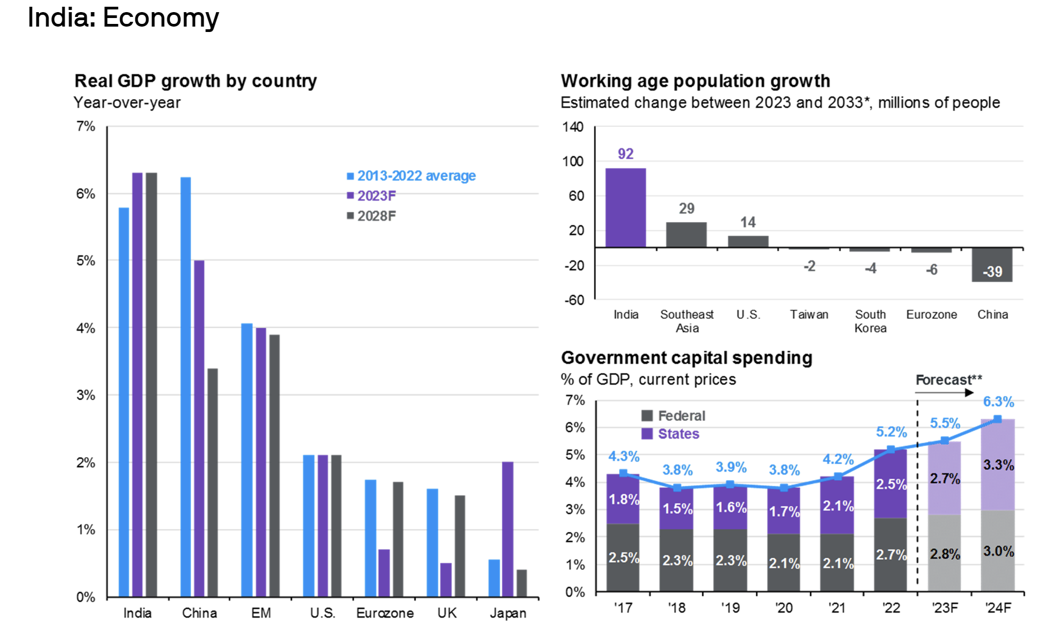
Source: J.P. Morgan Asset Management. (Left) International Monetary Fund (IMF), World Economic Outlook (WEO) – October 2023. Forecasts are provided by the IMF. (Top right) *Estimates are provided by Oxford Economics. Data as of 12/31/2023
[10] Source: International Monetary Fund
[11] Source: Bloomberg, China GDP per capita is $16,803 versus India’s $3,985. This is roughly equivalent to China at the end of 2009.
Source: Christian Alonso and Tanuj Bhojwani, “Stacking up the Benefits: Lessons from India’s Digital Journey”, March 31, 2023.
Electrification
Alternative energy spending, especially for solar and wind projects, fell off sharply with the rise in interest rates, contradicting our assumption that companies in this sector would thrive irrespective of the economy. Likewise, while Electric Vehicles keep growing, it appears car prices need to be lower to trigger elasticity of demand, and charging networks need to be expanded (Catch-22). We thought Lithium producers might be a good medium-term investment due to the huge quantities (growth) needed to fulfill electrification. However, it appears that it is far easier than we understood to quickly increase lithium capacity. Lithium prices have plunged to marginal cost.
Bitcoin
Interestingly, Bitcoin has rallied strongly after two of its leading figures have been convicted or admitted to criminal activities, possibly a classic trading bottom. We remain skeptical of cryptocurrency, as there are few legitimate use cases for citizens of well-developed democratic countries. It is far too volatile to be used as a medium for real-world contracts or loans and too slow for consumer transactions. Its “mining” validation mechanism is an astonishingly wasteful use of electricity and computing equipment, especially in an environmentally sensitive age.
Bitcoin is in another speculative wave on the expectation that the approval and introduction of U.S. ETFs will unlock enormous demand. As such ETFs are already available in other parts of the world one can estimate the potential demand for such ETFs by comparing the ETF market values to other market and economic indices. By our calculations, implied demand in the U.S. is not materially higher than the assets in the current “sub-optimal” Bitcoin-related ETFs.
Cryptocurrency volumes and stable coin assets, used as collateral for trading, have not increased meaningfully. It is possible the crypto enthusiasts are whipping themselves into a frenzy and not drawing capital from outside the system. If they collectively intend to monetize and utilize their crypto gains in the traditional financial system, buying physical assets like real estate, they will need to sell to new investors from outside the ecosystem. There’s little evidence that others are interested in Bitcoin (aside from its rising price).
Another widely cited bullish factor is the forthcoming “halving” of the reward (or printing rate) of bitcoin as new blocks are mined. These rewards amount to $38.7 million per day at current bitcoin prices.[12] This reward will be cut in half in April by the “constitutional” formulas governing Bitcoin. Investor excitement around the “halving” is due to the perception that halvings have caused a doubling (or more) of the dollar value per coin. Looking more closely at the price history, this appears more like hindsight bias for an asset which has rapidly appreciated in the past as the price increases pointed to are not always clearly occurring right at the time of the halving.
Bitcoin miners have been direct beneficiaries of the rise in the price of bitcoin despite the prospects of lower rewards. Bitcoin miners are involved in a capital-intensive arms race over the next Bitcoin block award. The incumbent miners, with cumulative investment in capital equipment far in excess of the current replacement cost of $44 billion, have by far the most “skin in the game” within the crypto ecosystem, and they stand to see their return on capital cut in half unless the price rises 100%. If one were to set the price of bitcoin equal to the cumulative investment in mining equipment (so that there was no “profit” in mining bitcoin or it had the characteristics of a perfectly competitive industry), we estimate that would generate a “book value” for each bitcoin of roughly $5,000 per coin, about 1/8th the current price.
[12] Current reward is 6.25 new bitcoin for each of the 144 blocks per day at $43,000 (roughly the price on 12/31/2023) that is $38.7 million per day.
For more news, information, and analysis, visit the ETF Strategist Channel.
Disclosures:
Copyright © 2024 Beaumont Capital Management LLC. All rights reserved. All materials appearing in this commentary are protected by copyright as a collective work or compilation under U.S. copyright laws and are the property of Beaumont Capital Management. You may not copy, reproduce, publish, use, create derivative works, transmit, sell or in any way exploit any content, in whole or in part, in this commentary without express permission from Beaumont Capital Management.
Certain information contained herein constitutes “forward-looking statements,” which can be identified by the use of forward-looking terminology such as “may,” “will,” “should,” “expect,” “anticipate,” “project,” “estimate,” “intend,” “continue,” or “believe,” or the negatives thereof or other variations thereon or comparable terminology. Due to various risks and uncertainties, actual events, results or actual performance may differ materially from those reflected or contemplated in such forward-looking statements. Nothing contained herein may be relied upon as a guarantee, promise, assurance or a representation as to the future.
This material is provided for informational purposes only and does not in any sense constitute a solicitation or offer for the purchase or sale of a specific security or other investment options, nor does it constitute investment advice for any person. The material may contain forward or backward-looking statements regarding intent, beliefs regarding current or past expectations. The views expressed are also subject to change based on market and other conditions. The information presented in this report is based on data obtained from third party sources. Although it is believed to be accurate, no representation or warranty is made as to its accuracy or completeness.
The charts and infographics contained in this blog are typically based on data obtained from third parties and are believed to be accurate. The commentary included is the opinion of the author and subject to change at any time. Any reference to specific securities or investments are for illustrative purposes only and are not intended as investment advice nor are they a recommendation to take any action. Individual securities mentioned may be held in client accounts. Past performance is no guarantee of future results.
As with all investments, there are associated inherent risks including loss of principal. Stock markets, especially foreign markets, are volatile and can decline significantly in response to adverse issuer, political, regulatory, market, or economic developments. Sector and factor investments concentrate in a particular industry or investment attribute, and the investments’ performance could depend heavily on the performance of that industry or attribute and be more volatile than the performance of less concentrated investment options and the market as a whole. Securities of companies with smaller market capitalizations tend to be more volatile and less liquid than larger company stocks. Foreign markets, particularly emerging markets, can be more volatile than U.S. markets due to increased political, regulatory, social or economic uncertainties. Fixed Income investments have exposure to credit, interest rate, market, and inflation risk. Diversification does not ensure a profit or guarantee against a loss.
The Standard & Poor’s (S&P) 500® Index is an unmanaged index that tracks the performance of 500 widely held, large-capitalization U.S. stocks. The S&P MidCap 400® measures the performance of 400 mid-sized companies. The S&P SmallCap 600® is designed to track 600 small-cap companies of the U.S. equity market that meet specific inclusion criteria to ensure that they are liquid and financially viable. The MSCI ACWI and MSCI ACWI Ex-USA Indices track developed and emerging market equity including or excluding the United States.
For Investment Professional use with clients, not for independent distribution.
Please contact your BCM Regional Consultant for more information or to address any questions that you may have.
Beaumont Capital Management LLC
125 Newbury St. 4th Floor, Boston, MA 02116 (844-401-7699)
