
Despite headwinds related to the ongoing pandemic, we see signs that the U.S. economy’s growth endures. The strong January jobs report is just one example of this continued economic strength. While the January jobs report beat expectations, we do not put much weight on any single monthly report due to the statistical noise and other factors, such as the large amount of uncertainty around omicron.
Instead, we prefer to look at the 6-month moving average jobs creation numbers that smooths out the data and helps put recent trends into context. As the following graph illustrates, the 6-month average jobs creation remains well above the average during economic expansions since 2000. This 6-month moving average includes the huge 708,000 jobs upside revision from the November and December reports, which would be missed if only looking at the headline for January.
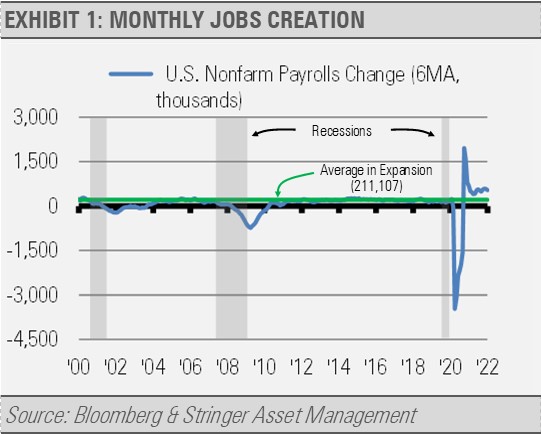
While the economy still has approximately 2.9 million fewer workers than it had at the pre-COVID peak, with 1.8 million fewer coming from the leisure and hospitality industry alone, business surveys suggest that the economy will continue to carry momentum and create new jobs in the months to come.
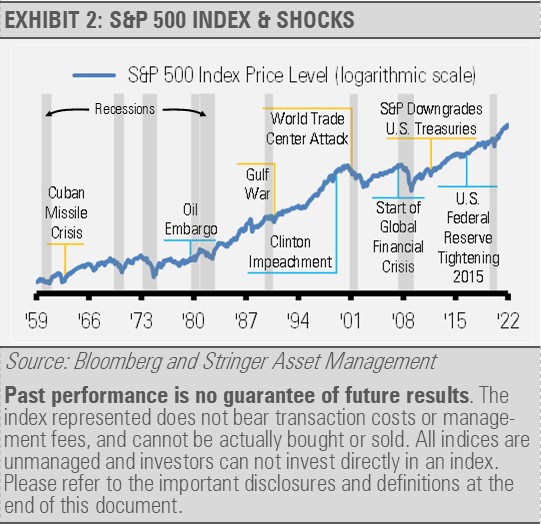
Moving to the markets, stock market volatility often coincides with headline risks. The continued economic momentum and strong jobs creation gives the U.S. Federal Reserve (Fed) the green light for its anticipated policy pivot from supporting growth to taming inflation. Historically, Fed shifts to a tightening policy as well as geopolitical risks have caused equity market volatility. Historically, outside of true recessionary environments these shocks are short-lived and last 40-50 days on average before reversing over a similar time period as the equity market pushes higher over time (exhibit 2). Our work suggests that the recent market volatility is normal and should be expected from the equity markets from time to time. From the perspective of our Cash Indicator, the indicator’s levels for the past few quarters have suggested a level of complacency that historically leads to increased volatility simply by pushing it to a more normalized range.
Our experience suggests that unless there is a recession on the horizon, volatility is a buying opportunity. At this time, we see little risk of economic damage leading to recession.
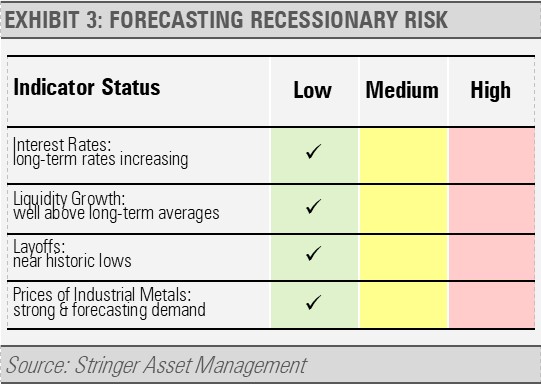
Looking at our broad set of recession risk indicators, none are showing significant signs of risk. These datapoints cover a broad range of economic indicators, such as interest rates, liquidity growth, layoffs, and the trends in the price of industrial metals.
This collection of tools has proved a reliable foundation for forecasting economic growth and contraction. As the economy grows, businesses adapt to the changing conditions, which contributes to revenue and earnings growth. It is typically when the economy is showing signs of recession that we become concerned about equity market volatility.
Based on these factors and more, our work suggests that we should be optimistic about economic growth as well as the strength of the private sector including households and businesses. As a result, we think that the recent equity market weakness will reverse in the coming weeks, and we view the recent market volatility as a buying opportunity.
THE CASH INDICATOR
The Cash Indicator (CI) has been useful for helping us judge potential volatility. The CI has moved from historically low levels to more moderate levels as more risk has been priced into the credit markets and equity markets. We think these shakeouts are normal and healthy. Combined with our strong fundamental view, the current CI level suggests that stock market declines in the near-term should represent buying opportunities.

DISCLOSURES
Any forecasts, figures, opinions or investment techniques and strategies explained are Stringer Asset Management, LLC’s as of the date of publication. They are considered to be accurate at the time of writing, but no warranty of accuracy is given and no liability in respect to error or omission is accepted. They are subject to change without reference or notification. The views contained herein are not be taken as an advice or a recommendation to buy or sell any investment and the material should not be relied upon as containing sufficient information to support an investment decision. It should be noted that the value of investments and the income from them may fluctuate in accordance with market conditions and taxation agreements and investors may not get back the full amount invested.
Past performance and yield may not be a reliable guide to future performance. Current performance may be higher or lower than the performance quoted.
Data is provided by various sources and prepared by Stringer Asset Management, LLC and has not been verified or audited by an independent accountant.
Index Definitions:
S&P 500 Index – This Index is a capitalization-weighted index of 500 stocks. The Index is designed to measure performance of a broad domestic economy through changes in the aggregate market value of 500 stocks representing all major industries.
