
Economic Overview
December 1, 2020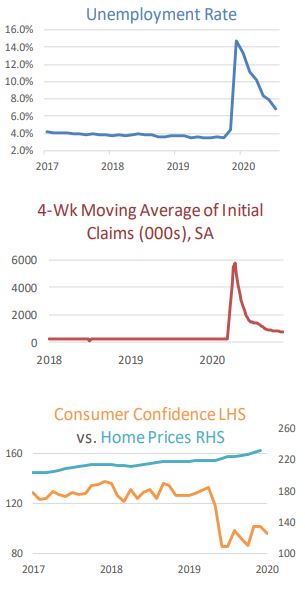
As we enter the final month of 2020, the strong economic recovery from the coronavirus pandemic experienced in Q2 and Q3 finds itself at risk due to a post-Halloween surge in cases both in the US and globally. Economic lock-downs are becoming more prevalent around the world and it’s likely that Q4 GDP will reflect a material decline in business activity. As we go to press, Congress is deliberating a scaledback stimulus bill, likely targeted at hard-hit travel and leisure business, including restaurants and small businesses.
With the US presidential election behind us, and despite the continued uncertainty around the Georgia senate race, markets appear to be shrugging off the current economic pullback, looking more at the promising vaccine news from a few of the major drug companies. A rollout of an effective vaccine appears imminent and investors would seem to be pricing a robust recovery beginning in early to mid 2021. Given the Fed’s preference for sustained low interest rates, equities are the obvious risk asset of choice to play any such economic rebound.
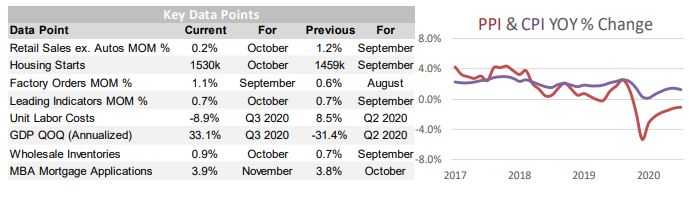
Housing in the US remains a bright spot for the economy. Despite a Building Permits number that was flat MoM in October, Housing Starts rose +4.9% MoM and Existing Home Sales rose +4.3% MoM. The S&P CoreLogic CS 20-City home price index gained +1.27% in September, showing a +6.57% YoY increase in home prices. Historically low mortgage rates combined with a surge of millennials moving from crowded apartments to single family homes are contributing to the demand for housing.
With the transition from the Trump to Biden administrations underway, markets are watching closely to see who is elected to fill key cabinet posts and what that might mean for future regulatory policy. Already, former Fed chair and known “dove” Janet Yellen will be Treasury Secretary. She’ll have big shoes to fill after the masterful job done by Secretary Mnuchin, but markets will likely take comfort in her expertise and the steady hand she showed while leading the Federal Reserve.
Domestic Equity
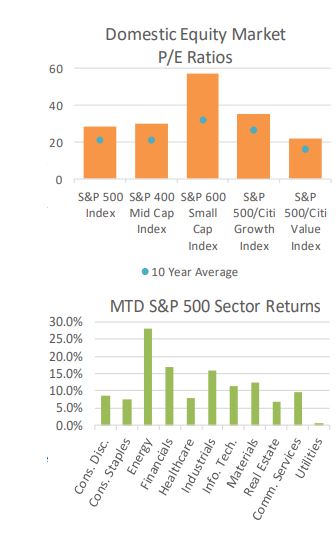
U.S. equities had a November to remember, with the benchmark S&P 500 index gaining +10.95% to close at 3,622. Gains were broad based, with Mid- and SmallCaps, as measured by the S&P 400 and 600 indices, gaining +14.27% and +18.16%, respectively. For the year, Large-, Mid-, and Small-Caps have all posted positive returns, up +14.02%, +6.70%, and +2.74%, respectively. For Dow watchers, the Dow Jones Industrial Average even crossed 30,000 for the first time, but still remains well behind the S&P 500 year to date, up only +6.11%.
Gains in November came as investor fears surrounding the 2020 Presidential Election dissipated and positive developments on COVID-19 vaccines and treatments were announced. Markets leading up to the election were likely pricing in a “Blue Wave” scenario where Democrats would win the White House, deepen their majority in the House of Representatives, and take over a majority in the Senate (i.e. the sharp sell-off at the end of October). While a “Blue Wave” scenario is not entirely off the table, it looks increasingly less likely. With two Georgia Senate seats set for a runoff on January 5, 2021, control of the Senate, and by extension the ability of President-elect Biden and the incoming administration to put forward signature legislative initiatives, hangs in the balance. Despite COVID-19 case counts and hospitalizations rising, markets continue to shrug off worsening data points and have instead turned their attention firmly to vaccines; however, much uncertainty around distribution remains.
From a style perspective, gains on the month were led by Value oriented sectors. Energy, Financials, and Industrials were the top performers, gaining +28.03%, +16.90%, and +15.97%, respectively. The S&P 500 Value Index rose +12.88% during the period, outpacing the broad market by almost two percentage points, and perhaps more importantly beating the S&P 500 Growth Index by more than three percentage points. Growth oriented sectors were not the laggards on the month, however. Information Technology (i.e. Apple, Microsoft) gained +11.43%, and Communication Services (Facebook, Google) gained +9.55%. Laggards instead included Real Estate and Utilities, which gained +6.95% and +0.72%, respectively. For the year, Information Technology, Consumer Discretionary, and Communication Services are the top performers, up +36.08%, +30.01%, and +19.92%, thanks to large components of Growth stocks. Growth has outperformed Value by more than 30 percentage points year to date, leaving many investors to wonder whether November’s Value driven gains are here to stay, or yet another head fake in a Growth hungry, low interest rate world. It should be noted that Information Technology has been the worst performing sector over the past three months, up a scant +0.07%, which could give room for a Santa Claus rally to end 2020.

International Equity
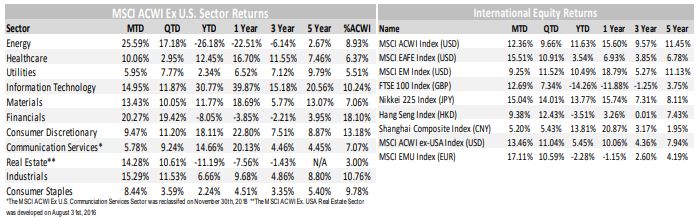
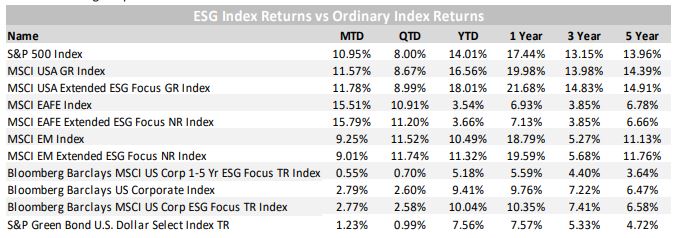
International Equities posted strong gains in November, led by Developed Markets (DM), as measured by the MSCI EAFE Index, which gained +15.51% during the period. Emerging Markets (EM), as measured by the MSCI EM Index, also posted strong gains, up +9.25% on the month. International equities rallied on the backs of positive COVID-19 vaccines and treatments, a President-elect Biden (who may be positive for international relations), and continued weakness in the U.S. Dollar. As a reminder, U.S. based investors in international markets have a third element of return (i.e. currency), and as the U.S. Dollar weakens, it boosts returns of international assets. With that said, the fact that the U.S. Dollar has been weakening for some time has already buoyed Emerging Markets, which are quietly up +10.49% year to date, well ahead of Developed Markets which have returned +3.54%, and not too far behind the S&P 500, which is up +14.01% on the year.
DM’s outperformance in November likely comes as a catch up trade given its underperformance for the first 10 months of the year, and the fact that its “recovery” has been slower compared to Asia and the U.S. both in terms of monetary and fiscal stimulus, as well as COVID-19 cases.
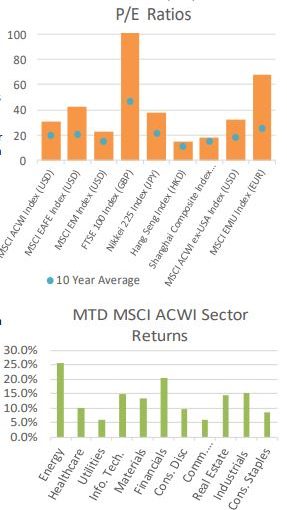
From a regional standpoint, the Eurozone, as measured by the MSCI EMU Index, was the standout, gaining +17.11% in EUR terms, and a more impressive +20.15% in USD terms thanks to a weaker U.S. Dollar and strengthening Euro. Japanese stocks also rallied sharply, with the Nikkei 225 Index gaining +15.04% in JPY terms, and +15.45% in USD terms, again thanks to a stronger local currency. China was notably left behind in November, with the Shanghai Composite gaining +5.20% in CNY terms, and +7% in USD terms, despite a surging Yuan on the back of stronger than expected economic data and continued containment of COVID-19.
Lastly, at the sector level, MSCI ACWI ex USA sector performance was led by Value oriented sectors such as Energy (+25.59%), Financials (+20.27%), and Industrials (+15.29%) as a resurrection in cyclical stocks benefitted from positive headlines during the month. With most of the developed world (i.e. Europe, Japan) firmly value and cyclically oriented, a path towards recovery in 2021 couldn’t come at a better time. For those growth oriented countries in Asia (i.e. China) that have recovered quicker, a re-opening of the world, and thus an expected surge in demand for its exports is also a light at the end of the tunnel heading into year end.
Fixed Income
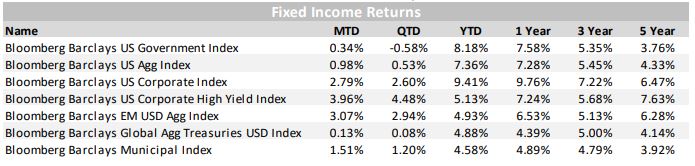
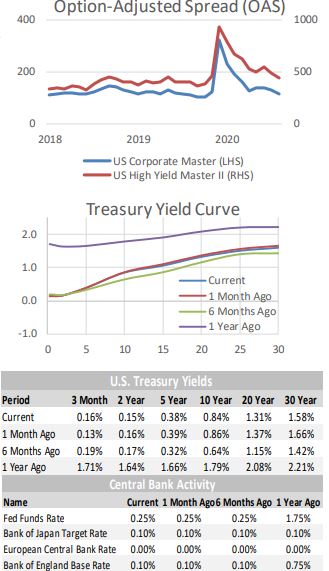 During the past month, we experienced a very strong Risk-On trade in the fixed income markets. The market is likely relieved to be on the other side of a contentious election. Investment Grade corporate bond spreads tightened, pushing prices higher. High Yield corporate bond spreads also tightened, boosting the price of Junk bonds. And completing the trifecta of a risk rally, Emerging Market bonds also turned in very strong performance, besting Investment Grade corporates, but trailing High Yield. Emerging Market central banks have cut rates significantly, but yields remain much higher than in the developed world (with the exception of Thailand). So far, they are unaffected by the lower bound/negative rates.
Tax-free Municipal bonds also had a strong month, rallying as the election results came in. Two things that are positive for municipal bonds became more likely. One, the likelihood of a stimulus bill that provides funds to municipalities is now higher. And two, the tax-free income that municipal bonds provide is likely to become even more appealing, as the incoming administration begins its work on (potential) income-tax reform. If they can get it passed, we would expect to see higher marginal tax-rates for higher earners, and a higher corporate tax-rate. Corporate demand for tax-free income (including in Bank investment portfolios) had dwindled after the corporate tax-rate was reduced. If it does move higher, we are likely to see a large buyer return to the market.
There was little yield curve movement in the past 30 days. None to speak of inside of 10 years. Longer rates, 10 years and beyond, did move a touch lower, giving a boost to the price/performance of longer dated Government bonds. Over the past six months, rates across the curve have moved higher, as economic expectations have bounced off their pandemic fueled lows.
With rates moving higher, we have heard renewed talk of the Federal Reserve capping interest rates, or implementing Operation Twist. This is a gambit from the Great Financial Crisis (GFC) playbook, where the Fed begins to focus more of its purchases on longer maturity Treasury bonds, in order to push interest rates lower.
Alternative Investments
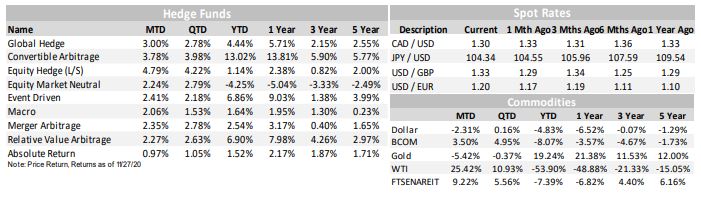
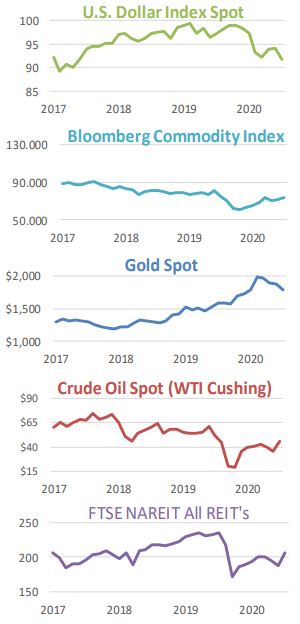 Alternative Investments were mostly positive in November, helped by a risk on environment that saw global equity prices rise sharply, as well as a weaker US Dollar. The US Dollar, as measured by the DXY Index, lost -2.31% in November and remains down -4.83% YTD.
The Dollar’s weakness propelled commodities upward, as measured by the Bloomberg Commodities Index, which rose +3.50% on the month. West Texas Intermediate (WTI) crude oil was up a staggering +25.42% in November to close at over $45/barrel on the NYMEX. OPEC, an intergovernmental organization of 13 oil-producing nations, pushed off its decision on whether to extend oil output cuts to this Thursday. International oil prices have rebounded strongly from their lows due to increased Asian demand and positive vaccine news, but
the cartel will have to decide whether it’s the correct time to add back more production.
Real Estate, as measured by the FTSE NAREIT All REIT Index rebounded strongly as well, rising +9.22% for the month.
Gold fell -5.42% for the month, hurt by the broad risk-on sentiment. However, the precious metal still remains one of the best performing asset classes YTD, up +19.24%. Hedge Fund strategies performed well during the month, with all nine strategies tracked posting positive returns on average. Long/Short Equity Hedge strategies were the top performer, up +4.79% on the month, while Absolute Return strategies were the worst performer, up only +0.97% during the period. Despite the recent performance, all strategies except Convertible Arbitrage have underperformed global equites, as measured by the ACWI Index, and broad fixed income, as measured by the Bloomberg Barclays US Aggregate Index YTD.
ESG
 With the Presidential election decided, and an administration that is very supportive of Environmental, Social, and Governance concerns beginning its transition into office, it is fair to say that the rising interest in ESG integrated investment strategies has now become a durable theme.
From the political appointments that have been announced so far, including John Kerry being named as Joe Biden’s special climate envoy, and his being given a seat on the National Security Council, the administration has clearly signaled that these concerns will remain front and center.
Again this month, we have experienced continued strong performance by the broad ESG indexes and ESG managers.
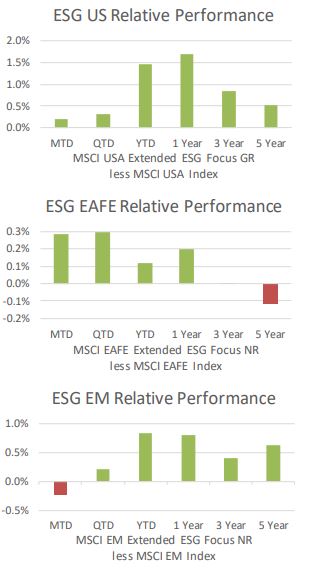
There is continued outperformance by the U.S. equity ESG benchmark. It certainly appears that Q4 will be a particularly good one for performance. The long term returns produced have also been strong.
The EAFE ESG benchmark provided a positive performance contribution again this month. Longer-term returns have improved to break even going back three years, and just a slight lag remains on a five year look back.
Bucking the trend of outperformance, EM ESG lagged a bit in the month, but remains highly accretive across all longer duration performance periods.
Fixed Income ESG integration has provided significant outperformance over time. The risk-on rally in bonds over the past few months have taken some of the steam out of recent performance numbers, but YTD it is still apparent where the risk management aspect of ESG integration lead to underweighting some of the lower quality areas of the market, resulting in lesser drawdown during the pandemic lows.
Disclosure
Nottingham Advisors, Inc. (“Nottingham”) is an SEC registered investment adviser with its principal place of business in the State of New York. Nottingham and its representatives are in compliance with the current registration requirements imposed upon registered investment advisers by those states in which Nottingham maintains clients. Nottingham may only transact business in those states in which it is registered, or qualifies for an exemption or exclusion from registration requirements. This material is limited to the dissemination of general information pertaining to Nottingham’s investment advisory/management services. Any subsequent, direct communication by Nottingham with a prospective client shall be conducted by a representative that is either registered or qualifies for an exemption or exclusion from registration in the state where the prospective client resides.
The information contained herein should not be construed as personalized investment advice. Past performance is no guarantee of future results. Information contained herein should not be considered as a solicitation to buy or sell any security. Investing in the stock market involves the risk of loss, including loss of principal invested, and may not be suitable for all investors. This material contains certain forward-looking statements which indicate future possibilities. Actual results may differ materially from the expectations portrayed in such forward-looking statements. As such, there is no guarantee that any views and opinions expressed in this letter will come to pass. Additionally, this material contains information derived from third party sources. Although we believe these sources to be reliable, we make no representations as to the accuracy of any information prepared by any unaffiliated third party incorporated herein, and take no responsibility therefore. All expressions of opinion reflect the judgment of the authors as of the date of publication and are subject to change without prior notice. Past performance is not an indication of future results.
The indices referenced in the Nottingham Monthly Market Wrap are unmanaged and cannot be invested in directly. The returns of these indices do not reflect any investment management fees or transaction expenses. Had these additional fees and expenses been reflected, the returns of these indices would have been lower. Information herein has been obtained from third party sources that are believed to be reliable; however, the accuracy of the data is not guaranteed by Nottingham Advisors. The content of this report is as current as of the date indicated and is subject to change without notice.
For information pertaining to the registration status of Nottingham, please contact Nottingham or refer to the Investment Adviser Public Disclosure web site (www.adviserinfo.sec.gov). For additional information about Nottingham, including fees and services, send for our disclosure statement as set forth on Form ADV from Nottingham using the contact information herein. Please read the disclosure statement carefully before you invest or send money.
