
By Roman Chuyan, CFA, President, CIO, Model Capital Management LLC
- Our Equity Model’s forecast for the S&P 500 remains positive as investors redeploy cash balances.
- A shift from Economic to Market factors occurred; momentum now drives the rally.
- Our models continue to dictate bullish positioning, but sentiment moves toward exuberance.
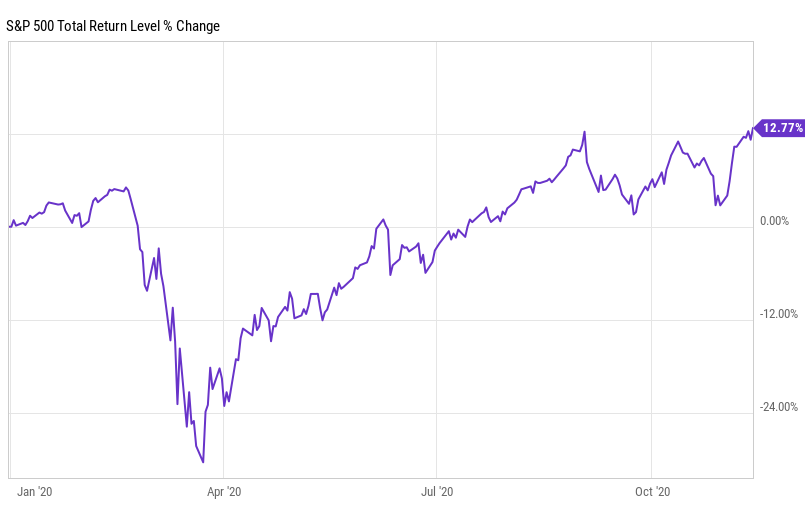
In my early-November article ‘Like A Rocket Ship,’ I explained how our models turned positive in a synchronized fashion, after the earlier market pullback, dictating bullish positioning. Accordingly, we moved our strategies into the market immediately, on November 2nd. Our models turned out to be right – the market took off like a rocket ship. The S&P 500 has rallied by 9.7% so far in November which took its year-to-date gain to 12.8%. This is an unusual immediate gratification – investors are typically rewarded for waiting.
US and Foreign Stocks, Year-To-Date
The 6-month return forecast for the S&P 500 by our fundamentals-based Equity model increased again, to 7.0% which continues to indicate “Positive Fundamentals” – see Market Outlook for details. While the market rose and became even more overvalued, other factors continue to offset it. We therefore keep our strategies in their maximum bullish allocations.
There’s a noteworthy change in the Equity model’s result: the positive contribution shifted from Economic to Market factors. Cash Balances became the largest positive factor in the model. Investors began to redeploy cash in October, but balances are still large and could continue to fuel the rally. Still, the shift from Economic to Market factors means that the rally became momentum driven, which suggests that it could be shorter. A momentum-driven rally ends when the cash on the sidelines is reinvested.
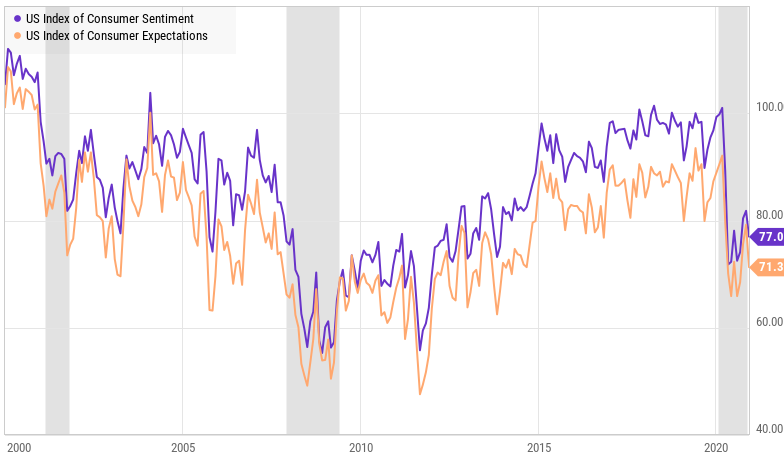
While the 33% annualized GDP growth testifies to the phenomenally strong economic rebound in the third quarter, some recent economic indicators weakened. Consumer Sentiment, which leads consumer spending, unexpectedly dropped in November to 77, and Consumer Expectations sub-index weakened to 71.3:
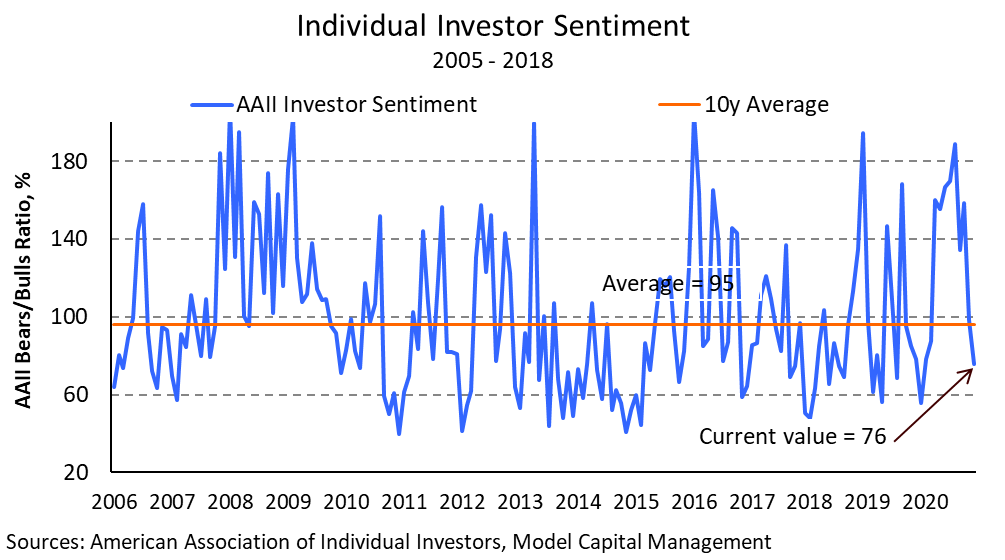
Our Short-Term Risk model will be critical in the coming weeks, in my view. The Investor Sentiment component of the model detects patterns of investors becoming exuberant. This typically means that they fully invested in the market and is often followed by a correction. This tool has been moving in the direction of exuberance as the market rallied. For example, the AAII Bears-to-Bills ratio, one of the seven indexes included in the Sentiment tool, dropped to as low as 45% last week (bullish investors outnumber bearish by more than 2-to-1) or to 76% on a moving-average basis:
It’s wonderful to take advantage of this rally for our clients, but there are plenty of potential triggers for a reversal. Daily US COVID cases rose to a record of 188,000 on Thursday. While better treatment keeps fatalities well below their April peak, daily deaths also began to rise. In addition, the presidential election is still contested. So, we’ll keep an eye on our Risk model and keep our options open.
About Model Capital Management LLC
Model Capital Management LLC (“MCM”) is an independent SEC-registered investment advisor, and is based in Wellesley, Massachusetts. Utilizing its fundamental, forward-looking approach to asset allocation, MCM provides asset management services that help other advisors implement its dynamic investment strategies designed to reduce significant downside risk. MCM is available to advisors on AssetMark, Envestnet, SMArtX, and other SMA/UMA platforms, but is not affiliated with those firms.
Notices and Disclosures
- This research document and all of the information contained in it (“MCM Research”) is the property of MCM. The Information set out in this communication is subject to copyright and may not be reproduced or disseminated, in whole or in part, without the express written permission of MCM. The trademarks and service marks contained in this document are the property of their respective owners. Third-party data providers make no warranties or representations relating to the accuracy, completeness, or timeliness of the data they provide and shall not have liability for any damages relating to such data.
- MCM does not provide individually tailored investment advice. MCM Research has been prepared without regard to the circumstances and objectives of those who receive it. MCM recommends that investors independently evaluate particular investments and strategies, and encourages investors to seek the advice of an investment adviser. The appropriateness of an investment or strategy will depend on an investor’s circumstances and objectives. The securities, instruments, or strategies discussed in MCM Research may not be suitable for all investors, and certain investors may not be eligible to purchase or participate in some or all of them. The value of and income from your investments may vary because of changes in securities/instruments prices, market indexes, or other factors. Past performance is not a guarantee of future performance, and not necessarily a guide to future performance. Estimates of future performance are based on assumptions that may not be realized.
- MCM Research is not an offer to buy or sell or the solicitation of an offer to buy or sell any security/instrument or to participate in any particular trading strategy. MCM does not analyze, follow, research or recommend individual companies or their securities. Employees of MCM may have investments in securities/instruments or derivatives of securities/instruments based on broad market indices included in MCM Research.
- MCM is not acting as a municipal advisor and the opinions or views contained in MCM Research are not intended to be, and do not constitute, advice within the meaning of Section 975 of the Dodd-Frank Wall Street Reform and Consumer Protection Act.
- MCM Research is based on public information. MCM makes every effort to use reliable, comprehensive information, but we make no representation that it is accurate or complete. We have no obligation to tell you when opinions or information in MCM Research change.
- MCM DOES NOT MAKE ANY EXPRESS OR IMPLIED WARRANTIES OR REPRESENTATIONS WITH RESPECT TO THIS MCM RESEARCH (OR THE RESULTS TO BE OBTAINED BY THE USE THEREOF), AND TO THE MAXIMUM EXTENT PERMITTED BY LAW, MCM HEREBY EXPRESSLY DISCLAIMS ALL WARRANTIES (INCLUDING, WITHOUT LIMITATION, ANY IMPLIED WARRANTIES OF ORIGINALITY, ACCURACY, TIMELINESS, NON-INFRINGEMENT, COMPLETENESS, MERCHANTABILITY AND/OR FITNESS FOR A PARTICULAR PURPOSE).
- “Model Return Forecast” for 6-month S&P 500 return is MCM’s measure of attractiveness of the U.S. equity market obtained by applying MCM’s proprietary statistical algorithm and historical data, but is not promissory, and, by itself, does not constitute an investment recommendation. Model Return Forecasts were calculated and applied by MCM to its research and investment process in real time beginning from 2012. For periods prior to Jan 2012, the results are “back-tested,” i.e., obtained by retroactively applying MCM’s algorithm and historical data available in Jan 2012 or thereafter. Source for the S&P 500 actual returns: S&P Dow Jones.
- Index returns referenced in MCM Research, if any, are gross of any advisory fees, fund management fees, and trading expenses. Fund or ETF returns referenced, if any, are gross of advisory fees and trading expenses. Returns will be reduced by fees and expenses incurred.
