
Why we got back in the market
Note: this report was sent to our clients on 11/2/2020. Stocks took off like a rocket ship since then.
- Our Equity Model’s outlook for the S&P 500 changed from Neutral to Positive.
- Our Short-Term Risk model gave a Buy signal after a 6% market drop over two weeks.
- Both models now dictate bullish positioning, and we reinvest in the market.
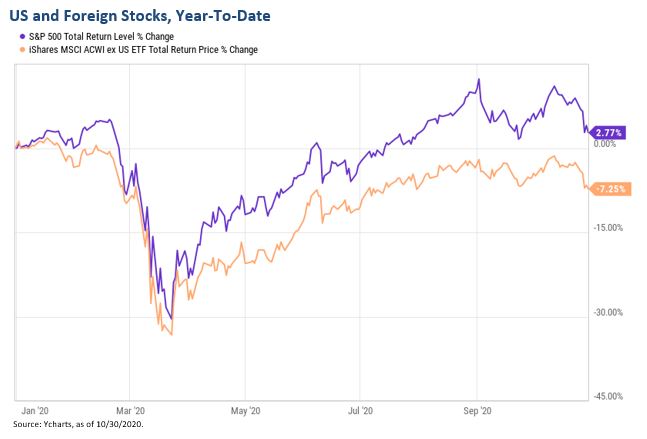
In my recent articles, I wrote that the market “might get interesting” before the election. Our short-term risk model had been giving a Sell signal since early September. We thought that a “resurgence in COVID … or shifts in the election chances could trigger short-term volatility” (October-20th article). That’s what happened. The S&P 500 has plummeted by 6.1% since mid-October, which took its year-to-date gain down to 2.8% (including dividends). Foreign equities dropped by 7.3% YTD, underperforming US by a 10% margin:
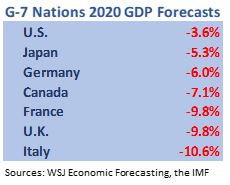 Estimates for the full year 2020 show the US leading most other countries by far in terms of economic effect of the pandemic. US GDP is now expected to drop by only 3.6% this year from 2019. By comparison, Germany, which was lauded for its strict COVID restrictions, is expected to drop by 6%, and France and the UK by 9.8%. And lockdowns are being re-imposed in Europe because of COVID resurgence: in France last Friday and in Germany and the UK this week. Clearly, the US approach is working the best overall – nothing beats common business sense. Keep it up.
As a side note, this also suggests that US investors should sail close to home. Market growth is driven by economic growth in the long run. Our strategies are US-only.
Due to continued improvement in economic factors and to lower market valuation, our Equity Model has now shifted from Neutral Fundamentals to Positive Fundamentals (the left vertical on the chart below) – see Market Outlook for details. In addition, our Short-Term Risk model gave a closing Buy signal. As I explained previously, the two models work in concert. Both models now dictate bullish, risk-on positioning in our strategies. We therefore shift our strategies to their maximum bullish allocations.

The resurgence in COVID cases and uncertainty around the presidential election have given investors chills in the past two weeks, but are these real concerns? Our premise at Model Capital is that fundamentals drive markets: they determine the trend. Things like COVID fluctuations and elections create “noise” around the trend – transitory effects that are hard to predict and don’t last. I like to say that the market is bipolar. Anxious right now, investors were exuberant just two weeks ago based on “stimulus.”
Yes, US daily COVID cases hit an all-time high of 91,530 yesterday. Even though this is being hyped by the media, I don’t think that it’s a real concern for the market. Deaths, which are driven by cases but also by therapeutics and other factors, have ticked up only slightly:

It’s difficult to predict the effect of the election. Uncertainty is bad for the market, and – as I wrote to our clients in the past month – it wasn’t previously priced into the market. The 6% two-week drop might have factored in most of the uncertainty. This is good to see. When it’s over (hopefully the night of November 3rd), we might get a relief rally either way.
Let me be clear once again – we at Model Capital continue to follow our systematic, model-based process. Our models have now turned positive and dictate that we get back in the market. The timing is not accidental: the models turned positive in part because of the market’s recent drop. It improved valuation within the Equity model and helped trigger a Buy signal from the Risk model. It’s not always as synchronized because lags and market noise get in the way. So, such just-in-time model signals synchronized with the market’s pullback is good to see, and allows us to buy near the lows of the past three months.
Market Outlook
The outlook for the S&P 500 by our fundamentals-based statistical model improved again this month. Improvements in economic factors and lower valuation due to the market drop contributed roughly equally to the improvement in the model. The forecast has now shifted to a “Positive Fundamentals” range above 3%. Combined with the Buy signal by our Short-Term Risk model, this now dictates bullish allocation.
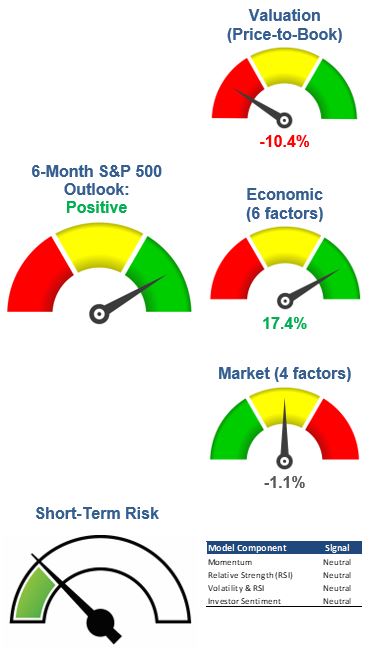 The Price-to-Book Ratio dropped to 3.6 from 3.82 last month as a result of the market drop, and the effect of this factor increased by 5.4% in October to -10.4%. While on its own it continues to indicate an overvalued stock market, the sum-total of all factors is what matters. Stocks typically remain expensive during growth periods.
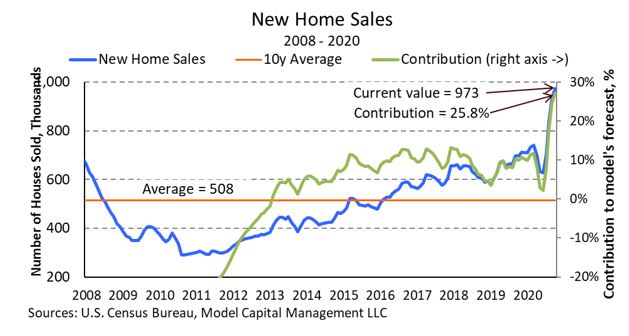
New Home Sales has shown tremendous strength in the past three months, rising to its highest since 2007. Its contribution to the model’s forecast, at 25.8%, remains by far the most positive in the model and was responsible for the 6.6% increase in the overall effect of Economic factors this month to 17.4%. Changes in other factors had smaller positive and negative effects.
The overall effect of Market factors decreased slightly this month on small changes in Cash Balances and interest rates.
Our Short-Term Risk model looks for technical patterns that preceded previous sharp market declines. The model’s Volatility component gave a Buy signal on Oct 30th, closing its Sep 4th Sell signal. This protective trade was positive, as the S&P 500 declined by around 4% from Sell to Buy.
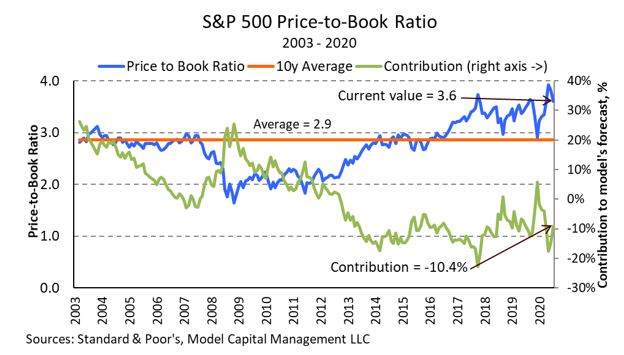
Some of the Equity Model’s most negative and positive factors are shown below in historical context (assuming their current weights). The S&P 500 Price-to-Book Ratio decreased to 3.6 from 3.82 last month, down from its peak of 3.93 in August. The contribution of this factor rose to ‑10.4% from -15.8 last month. While not cheap, this points to improvement in market valuation.
New Home Sales has shown tremendous strength over the past three months on historically low mortgage rates. The effect of this factor jumped to 25.8% and continues to be the most positive in the model.
About Model Capital Management LLC
Model Capital Management LLC (“MCM”) is an independent SEC-registered investment advisor, and is based in Wellesley, Massachusetts. Utilizing its fundamental, forward-looking approach to asset allocation, MCM provides asset management services that help other advisors implement its dynamic investment strategies designed to reduce significant downside risk. MCM is available to advisors on AssetMark, Envestnet, SMArtX and other SMA/UMA platforms, but is not affiliated with those firms.
Notices and Disclosures
- This research document and all of the information contained in it (“MCM Research”) is the property of MCM. The Information set out in this communication is subject to copyright and may not be reproduced or disseminated, in whole or in part, without the express written permission of MCM. The trademarks and service marks contained in this document are the property of their respective owners. Third-party data providers make no warranties or representations relating to the accuracy, completeness, or timeliness of the data they provide and shall not have liability for any damages relating to such data.
- MCM does not provide individually tailored investment advice. MCM Research has been prepared without regard to the circumstances and objectives of those who receive it. MCM recommends that investors independently evaluate particular investments and strategies, and encourages investors to seek the advice of an investment adviser. The appropriateness of an investment or strategy will depend on an investor’s circumstances and objectives. The securities, instruments, or strategies discussed in MCM Research may not be suitable for all investors, and certain investors may not be eligible to purchase or participate in some or all of them. The value of and income from your investments may vary because of changes in securities/instruments prices, market indexes, or other factors. Past performance is not a guarantee of future performance, and not necessarily a guide to future performance. Estimates of future performance are based on assumptions that may not be realized.
- MCM Research is not an offer to buy or sell or the solicitation of an offer to buy or sell any security/instrument or to participate in any particular trading strategy. MCM does not analyze, follow, research or recommend individual companies or their securities. Employees of MCM may have investments in securities/instruments or derivatives of securities/instruments based on broad market indices included in MCM Research.
- MCM is not acting as a municipal advisor and the opinions or views contained in MCM Research are not intended to be, and do not constitute, advice within the meaning of Section 975 of the Dodd-Frank Wall Street Reform and Consumer Protection Act.
- MCM Research is based on public information. MCM makes every effort to use reliable, comprehensive information, but we make no representation that it is accurate or complete. We have no obligation to tell you when opinions or information in MCM Research change.
- MCM DOES NOT MAKE ANY EXPRESS OR IMPLIED WARRANTIES OR REPRESENTATIONS WITH RESPECT TO THIS MCM RESEARCH (OR THE RESULTS TO BE OBTAINED BY THE USE THEREOF), AND TO THE MAXIMUM EXTENT PERMITTED BY LAW, MCM HEREBY EXPRESSLY DISCLAIMS ALL WARRANTIES (INCLUDING, WITHOUT LIMITATION, ANY IMPLIED WARRANTIES OF ORIGINALITY, ACCURACY, TIMELINESS, NON-INFRINGEMENT, COMPLETENESS, MERCHANTABILITY AND/OR FITNESS FOR A PARTICULAR PURPOSE).
- “Model Return Forecast” for 6-month S&P 500 return is MCM’s measure of attractiveness of the U.S. equity market obtained by applying MCM’s proprietary statistical algorithm and historical data, but is not promissory, and, by itself, does not constitute an investment recommendation. Model Return Forecasts were calculated and applied by MCM to its research and investment process in real time beginning from 2012. For periods prior to Jan 2012, the results are “back-tested,” i.e., obtained by retroactively applying MCM’s algorithm and historical data available in Jan 2012 or thereafter. Source for the S&P 500 actual returns: S&P Dow Jones.
- Index returns referenced in MCM Research, if any, are gross of any advisory fees, fund management fees, and trading expenses. Fund or ETF returns referenced, if any, are gross of advisory fees and trading expenses. Returns will be reduced by fees and expenses incurred.
