By Marc Odo, CFA, FRM, CAIA, CIPM, CFP
A cruder version of the above phrase, “Mess Around and Find Out”, has gained popularity in the American vocabulary. Politicians keep messing around with the creditworthiness of the nation’s sovereign debt. On August 1st, they found out.
Downgrades
Following yet another showdown and near-default on the country’s fiscal obligations, on August 1st Fitch Ratings downgraded the United States’ credit rating from AAA to AA+. Some politicians and officials expressed shock at the move—Treasury Secretary Janet Yellen called the downgrade “puzzling.” However, we at Swan Global Investments are surprised the move didn’t come sooner.
Given the deterioration of the country’s financial outlook the downgrade is entirely appropriate. Fitch’s recent move parallels Standard and Poor’s downgrade in the summer of 2011. In both cases the downgrade was a response to political brinkmanship as the U.S. neared the self-imposed debt ceiling spending limits.
The decline of the United States’s fiscal forecast is driven by what we’ve been calling “The Three D’s”: Deficits, Debt and Demographics.
Deficits
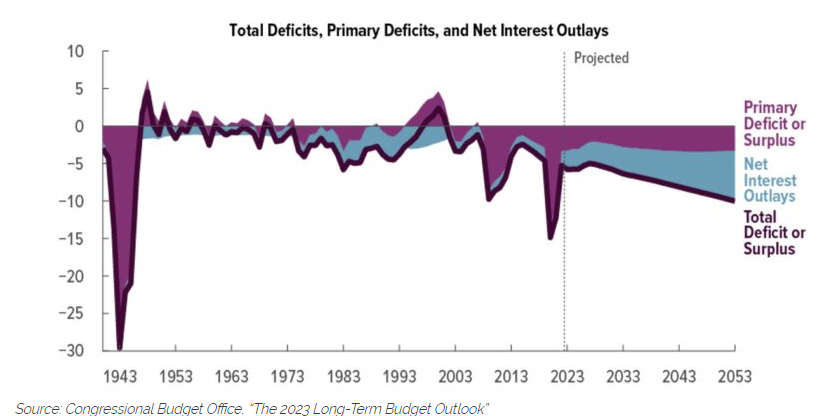
On an annual basis, the United States’ spending has exceeded its revenues every year of the 21st Century. Spending spiked and revenue dropped during the Global Financial Crisis of 2007-09 and the Covid-19 Pandemic, but the annual deficit has averaged around 3% to 5% in most years. This level of spending was somewhat affordable when interest rates were suppressed throughout the first two decades of the century.
However, one of the supports of this spendthrift policy has been knocked out. The Federal Reserve Bank has been forced to undo years of loose monetary policy to tame the inflation spike of 2022. With rates climbing to 4-5%, net interest expense is forecast to grow from 2.5% of GDP to 6.7% of GDP in thirty years’ time. This, combined with anticipated increases in mandatory Federal entitlement programs, is forecast to push the annual deficits up from -5.8% of GDP in 2023 to -10.0% of GDP by 2053.

Debt
Year after year of deficit spending is financed by the issuance of increasing amounts of debt. The sheer volume of Federal debt outstanding is roughly equal to the amount of debt the United States accumulated during World War II, at around 100% of GDP. Given the acceleration of spending and increased interest rate costs, the Congressional Budget Office anticipates the Federal debt climbing to 181% of GDP by 2053, an unprecedented level.
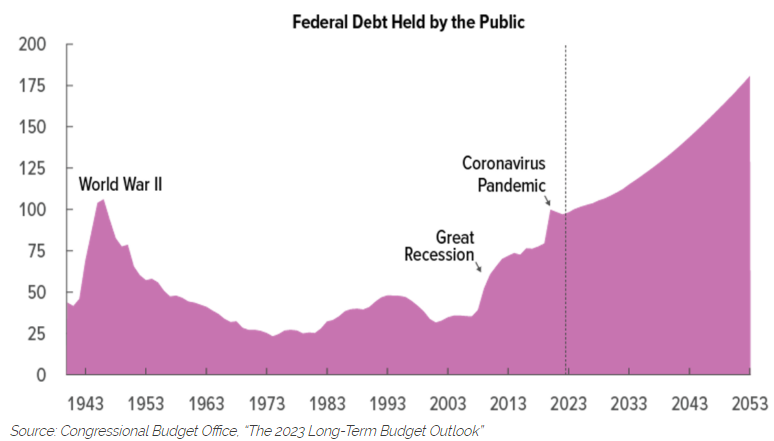
The non-partisan CBO is quite clear about the risks of accumulating such high levels of debt. In their report “The 2023 Long-Term Budget Outlook” they specify the following risks:
- Borrowing costs throughout the economy would rise, reducing private investment and slowing the growth of economic output.
- Rising interest costs associated with that debt would drive up interest payments to foreign holders of U.S. debt, decreasing the nation’s net international income.
- There would be an elevated risk of a fiscal crisis—that is, a situation in which investors lose confidence in the U.S. government’s ability to service and repay its debt, causing interest rates to increase abruptly, inflation to spiral upward, or other disruptions to occur.
- The likelihood of other adverse effects would also increase. For example, expectations of higher rates of inflation could become widespread, which could erode confidence in the U.S. dollar as the dominant international reserve currency.
- The United States’ fiscal position would be more vulnerable to an increase in interest rates, because the higher debt is, the more an increase in interest rates raises debt-service costs.
- Lawmakers might feel constrained in using fiscal policy to respond to unforeseen events or for other purposes, such as to promote economic activity or strengthen national defense.
Despite these clear risks, politicians of both parties refuse to adequately address the problem.
Demographics
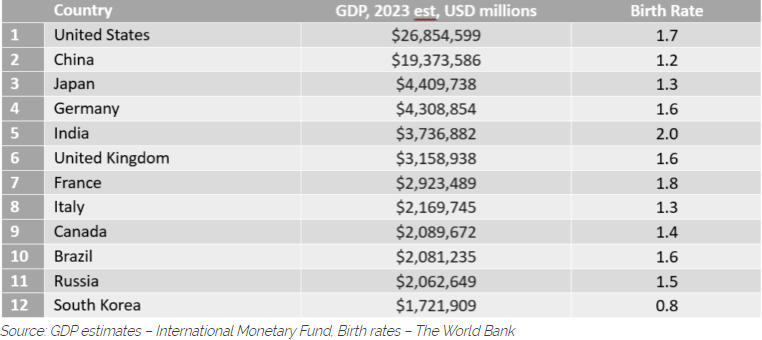
The third major headwind facing the United States as well as many developed and emerging economies are negative demographic trends. As Baby Boomers retire and start drawing entitlements the burden on the economy increases. Moreover, America’s birthrate of 1.7 live births per woman is currently below the replacement level of 2.1. If this rate does not increase or if immigration does not add to the overall population, an increasing fiscal burden will be placed on a shrinking base of workers.
Yet compared to many of its large economy peers, America is in great shape. The table below highlights the world’s top economies and compares their birthrates. All the top twelve countries have birth rates below the replacement rate of 2.1, including the four “BRICs” countries of Brazil, Russia, India, and China.
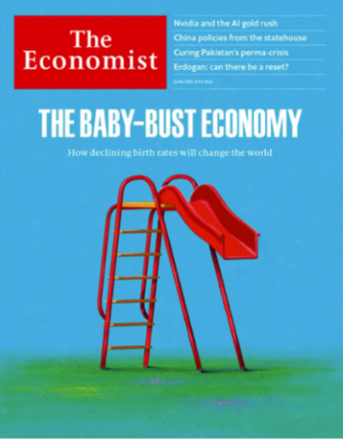
Sadly, as demographics start to skew older, economies become less dynamic. This problem was recently explored in-depth in an excellent cover story from “The Economist.” Older citizens look to their governments to maintain a certain level of comfort at the cost of long-term economic growth.
It is Swan Global Investments’ belief that the private sector is far more productive than the public sector and that bloated governments tend to drag down economic growth.
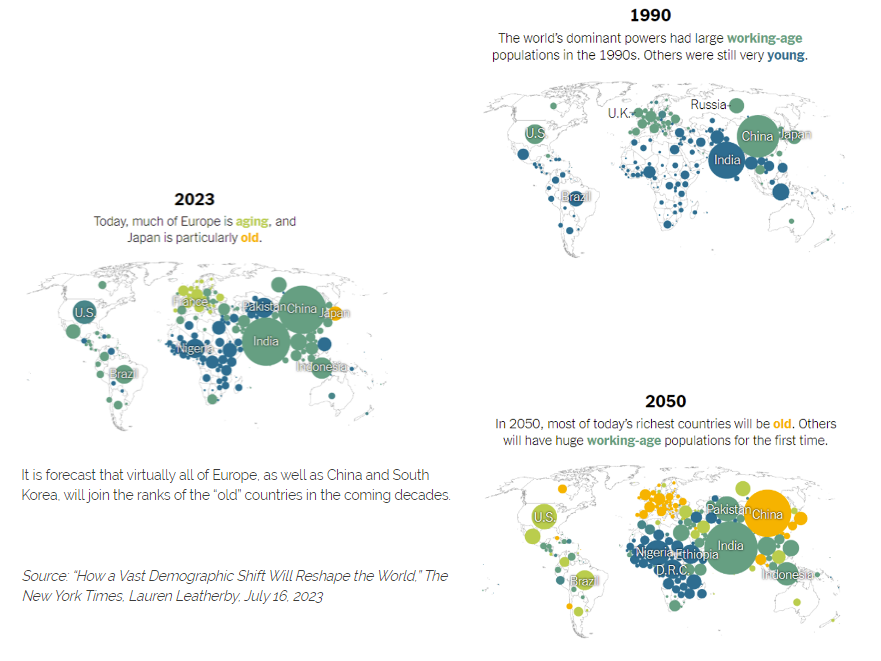
The maps below show how the world’s demographics have shifted and will shift over the coming decades. Japan was the first country to tip into the yellow “old” zone, currently with a median age of 48.4.
It is worth noting that the Japanese market and economy peaked in 1990; since then both have been in an extended malaise.
The graph below shows the size of government spending relative to the overall economy for the United States as well as some major European economies over the last 70 years.
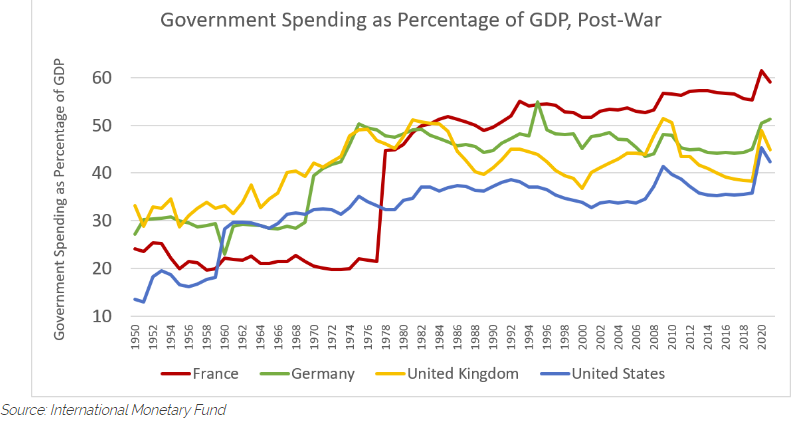
The United States spiked north of 40% during the Covid-19 Pandemic, but the major European economies of France, Germany, and the United Kingdom have been living in that range for decades.
How has ‘Leviathan‘-sized government helped European economies?
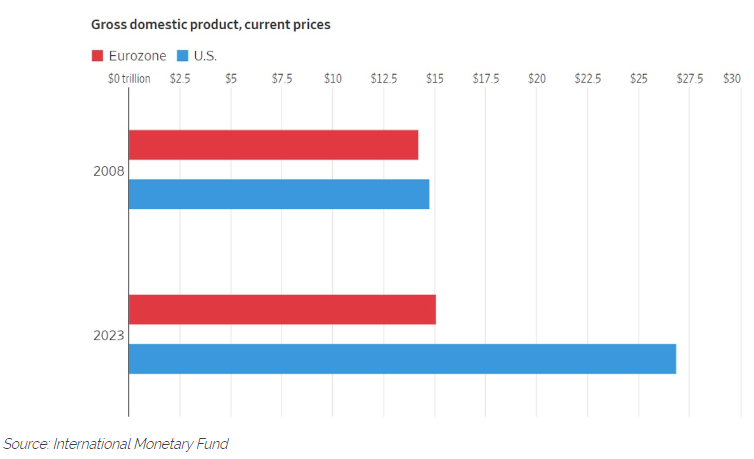
A recent article in The Wall Street Journal[1], titled “Europeans Are Becoming Poorer. ‘Yes, We’re All Worse Off’” shows that the United States and the Eurozone’s economies were roughly the same size in 2008. Since then, the U.S. economy has almost doubled while the Eurozone has hardly grown at all.
America’s economy is nearly twice the size of the Eurozone’s. They were similar in 2008.
None of these megatrends bode well for the United States or the rest of the globe. Economies will struggle to grow, and it will be increasingly difficult for countries to meet the promises doled out to their citizens and lenders.
A Lacking Response
Facing the quite serious problems of deficits, debt, and demographics, both Congress and the White House have responded with three “Ds” of their own: denial, dithering, and drama.
- Denial: a shocking number of Congressmen and presidents past and present are in denial about the problem. Despite all the evidence, some simply refuse to admit we have a problem. Cynical observers would say politicians don’t really care about much beyond the next election cycle.
- Dithering: the self-imposed debt ceiling has been in place since 1917. Any time the government comes close to breaching the debt limits the response has been the same: to either suspend or bump up the credit limits to avoid a technical default. The can is kicked down the road for a few months or years. Meanwhile, the fundamental problem of inadequate revenue and unsustainable spending goes unaddressed. Since the start of the 21st century, this has happened 24 times.
- Drama: perhaps the most shameful feature of the periodic debt showdowns is the drama and grandstanding that accompany it. Rather than solve the problem, many politicians of both parties opportunistically use the spotlight for petty, short-term politicking and point-scoring. This is wholly irresponsible.
Given the scale of the problem and the lack of seriousness given to the deficit, debt, and demographic situation it is no wonder that Standard and Poor’s and then Fitch’s took this action. Inevitably, this led us to another “D”- downgrade. Let us hope that “default” does not follow.
New Portfolio Tool for Uncertain Times
Debt is piling up. Interest rates are being held higher, for longer. Little or no economic growth. Lower tax revenues and higher obligations, necessitating more debt and more money printing.
Unless the United States wakes up to the problem, the problem will get worse.
Given the denial, dithering, and drama, Swan Global Investments doesn’t believe one should have a lot of optimism that government will wake up, much less solve the problem. Investors will have to prepare their portfolios for the possibility of a full-blown economic crisis.
Our view is that one should actively manage risk.
A crisis precipitated by a debt default would likely have an extreme negative impact on both stocks and bonds. A portfolio that utilizes diversification risks the possibility that most traditional investments could nosedive in lockstep during a crisis, like in 2022.
Given that correlations between major asset classes have historically converged in times of market stress, Swan’s hedged equity strategies incorporate inversely correlated put options. Since 1997 our hedged equity Defined Risk Strategy maintains passive equity market exposure via broad equity index ETFs for long-term growth while actively managing risk with long-term put options to directly mitigate market risk.
Building portfolios with strategies that incorporate inversely correlated components, such as our options-based hedged equity strategies may help investors navigate market uncertainty ahead—seeking to participate in whatever growth the economy can muster while mitigating volatility and market risk.
Important Notes and Disclosures:
Swan Global Investments, LLC is a SEC registered Investment Advisor that specializes in managing money using the proprietary Defined Risk Strategy (“DRS”). SEC registration does not denote any special training or qualification conferred by the SEC. Swan offers and manages the DRS for investors including individuals, institutions and other investment advisor firms.
All Swan products utilize the Defined Risk Strategy (“DRS”) but may vary by asset class, regulatory offering type, etc. Accordingly, all Swan DRS product offerings will have different performance results due to offering differences and comparing results among the Swan products and composites may be of limited use. All data used herein; including the statistical information, verification and performance reports are available upon request. The adviser’s dependence on its DRS process and judgments about the attractiveness, value and potential appreciation of particular ETFs and options in which the adviser invests or writes may prove to be incorrect and may not produce the desired results. There is no guarantee any investment or the DRS will meet its objectives. All investments involve the risk of potential investment losses as well as the potential for investment gains. Prior performance is not a guarantee of future results and there can be no assurance, and investors should not assume, that future performance will be comparable to past performance. Further information is available upon request by contacting the company directly at 970-382-8901 or www.swanglobalinvestments.com. 161-SGI-081123
For more news, information, and analysis, visit the ETF Strategist Channel.

