

Our Cash Indicator methodology acts as a plan in case of an emergency. This is analogous to the multiple safety systems in a modern automobile, which includes an airbag. Importantly, each of these systems work together to potentially help smooth the ride.
We manage risk within our strategic, long-term allocations based on diversification across equity, fixed income, and alternative assets and a focus on more attractive relative values.
We manage risk tactically over the short-term by investing across a broad array of themes and asset classes including cash. We can either invest opportunistically or defensively depending on the environment.
Cash Indicator: Markets are functioning properly, but we expect continued volatility.
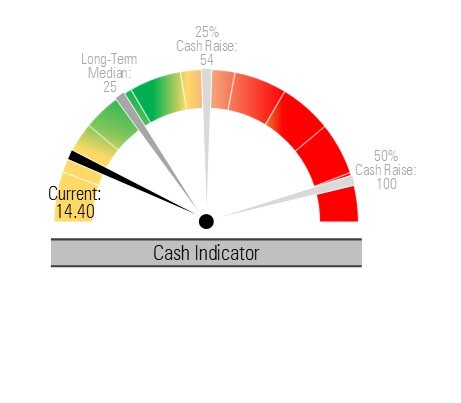
Our proprietary Cash Indicator (CI) provides insight into the health of the market by monitoring the level of fear using equity and fixed income indicators. This warning system is designed to signal us to either a 25% or 50% cash position to potentially protect principle and provide liquidity to reinvest at lower and more attractive valuations.
The CI level remains elevated from recent lows but continues to hold below historical norms. This suggests that markets are still exhibiting complacency and may be vulnerable to downside surprises.
Strategic View: Fixed income valuations remain attractive, as do value and dividend-oriented equities.
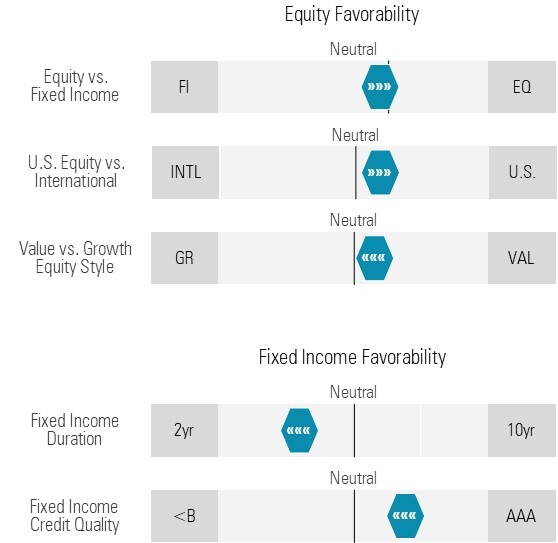
Equity Valuations: Solid earnings growth combined with an equity market pullback make valuations more attractive. That said, the capitalization weighted indices remain expensive. However, other areas of the global equity market look more attractive, especially the value style and dividends.
Equity Favorability: Recent broader U.S. equity market participation is a healthy sign. We expect this broadening to continue along with U.S. economic growth. We remain overweight U.S. equities relative to foreign, especially favoring the value style and dividend payers.
Fixed Income Valuations: At current interest rates, high quality fixed income looks very attractive while high yield is less attractive on a risk-reward basis.
Fixed Income Favorability: While still taking less interest rate risk than the broader bond market, we have emphasized the intermediate portion of the yield curve through defined maturity ETFs in order to lock in higher interest rates. If short-term interest rates fall in the coming months as we expect, the income generated by intermediate holdings will remain stable even as these bond prices appreciate.
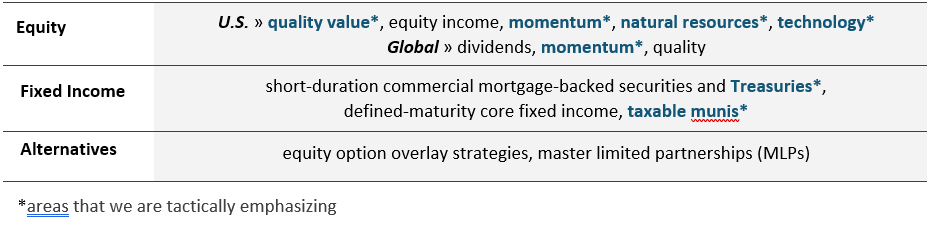
Tactical View: We favor value, quality, and momentum equity, as well as investment grade intermediate fixed
Recent data suggests that the worst of the headwinds for the global economy may have dissipated, which shifts the tactical opportunities set for global equities. Increased global economic growth should lead to more demand for natural resources, such as agricultural goods, energy, and industrial metals. We recently purchased a global natural resources ETF that may benefit from these trends. Meanwhile, we think uncertainty has increased for both short-term and long-term U.S. interest rates. As a result, we adjusted our fixed income allocations to be more focused on intermediate duration by increasing our existing allocations to defined maturity ETFs to reduced short-term interest rates.
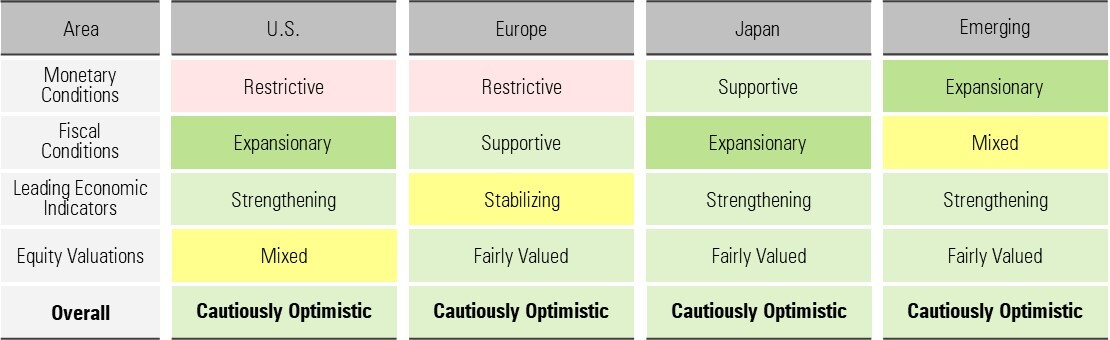
Global Broad Outlook: Global economic activity has improved, broadening the opportunity set.
For more news, information, and analysis, visit the ETF Strategist Channel.
DISCLOSURES
Any forecasts, figures, opinions or investment techniques and strategies explained are Stringer Asset Management, LLC’s as of the date of publication. They are considered to be accurate at the time of writing, but no warranty of accuracy is given and no liability in respect to error or omission is accepted. They are subject to change without reference or notification. The views contained herein are not be taken as an advice or a recommendation to buy or sell any investment and the material should not be relied upon as containing sufficient information to support an investment decision. It should be noted that the value of investments and the income from them may fluctuate in accordance with market conditions and taxation agreements and investors may not get back the full amount invested.
Past performance and yield may not be a reliable guide to future performance. Current performance may be higher or lower than the performance quoted.
Data is provided by various sources and prepared by Stringer Asset Management, LLC and has not been verified or audited by an independent accountant.