
Market Summary & Technical Perspective
Given the holiday last week, it was a quiet week in the markets. Most major indexes traded with low volume. This is typical during the week of Thanksgiving.
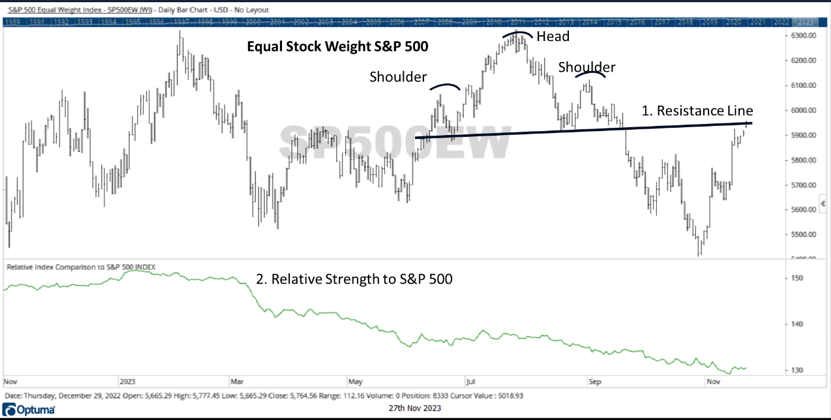
Source: Canterbury Investment Management. Chart created using Optuma Technical Analysis Software.
Here are a few bullets regarding the chart above:
- Following a fast and volatile move, the equal weight index is now at a point of resistance. This resistance occurs at the “neckline” of a “head & shoulders” chart pattern that formed from May to September. A head and shoulders pattern is a bearish formation, and the equal weight index did experience a decline following the pattern. Now, it is testing that neckline for resistance.
- The lower half of the chart shows the equal weight index’s relative strength to the cap weighted S&P 500. The declining line of relative strength means that the equal weight index is underperforming the cap weighted index, through both its advances and declines. Most of the market’s strength has been fueled by the “magnificent 7” technology-related stocks. The average stock is basically flat in 2023.
- Although it is not shown in the chart, following the recent advance, the number of overbought stocks (meaning stocks that have gone too far, too fast) within the S&P 500 is now at its highest point since the market peaked in late July. This condition typically precedes a pullback to relieve the overbought condition.
Portfolio Comment & Bottom Line
Right now, markets are slightly overbought and nearing a point of resistance. The recent market fluctuations, both up and down, have been volatile. The average large cap stock just experienced a -14% decline followed by a +10% advance in under four months. That is not a characteristic of an efficient market, but rather an emotional one.
Bonds have been more volatile than stocks. Looking at the Canterbury Volatility Index (CVI), the Twenty-Year Treasury Bond ETF is about 30% more volatile than the S&P 500. Rising rates are bad for bond funds. Portfolios are constructed to reduce volatility, but bond funds could potentially be contributing to a portfolio’s volatility.
The Canterbury Portfolio Thermostat is constructed to have low volatility. Its holdings have low correlation to each other. Following the sharp kickback that we have seen in the last few weeks, the market’s volatility has gone up. The expectation is that markets will continue to fluctuate in both directions.
For more news, information, and analysis, visit the ETF Strategist Channel.
