
When bull markets end, they seldom go gentle into the night. As the market turns down, sharp rallies can occur, inflicting enormous pain on anyone underweight or short the declining asset class. Every decade or so, markets get carried higher by a structural theme which triggers an enormous re-rating of the favored asset class. Examples include Energy in the 1970’s after fears of “peak oil”, Japanese equities in the late 1980s, Internet stocks at the turn of the century, and most recently, US mega-cap tech stocks on the belief that “software eats the world”.
That brings us to 2023. This year, we have had a sharp rally in all thing’s tech, and especially in the “Magnificent Seven” stocks that have driven so much of US and global equity market performance in 2023. So, was the 40% gain in the Nasdaq between early January and July a typical post-bull-market surge? Or is this rally a continuation of the US growth stock bull market that started in 2011? Or is it the start of an altogether new bull market? (Chart 1).
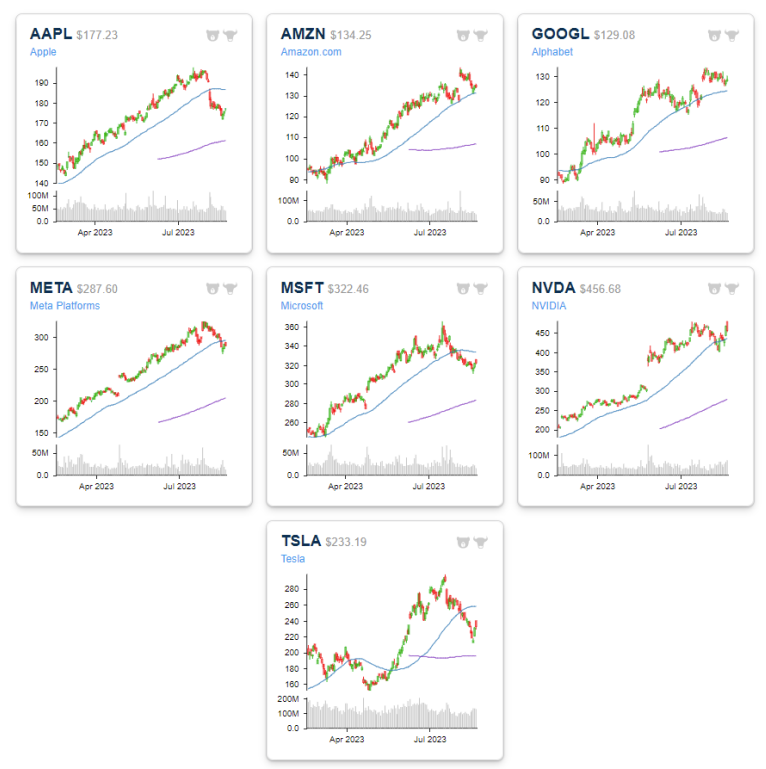
(Chart 1) Source: Bespoke Investment Group
While the answers to those questions will only come with time, since the beginning of August, it has looked as if the tech rally has run out of steam. Major equity indices are off their peaks, and the technical backdrop has become less clear. The S&P 500 and Nasdaq have both dipped below their 50-day moving average, and for the most part, the “Magnificent Seven” mega caps are showing cracks.
US long-dated bonds have not been sending the same message as stocks this year. Treasuries have rolled over, and yields have taken out highs from October 2022. Equity multiple expansion and yields, which have recently moved in tandem, have meaningfully decoupled. (Chart 2).
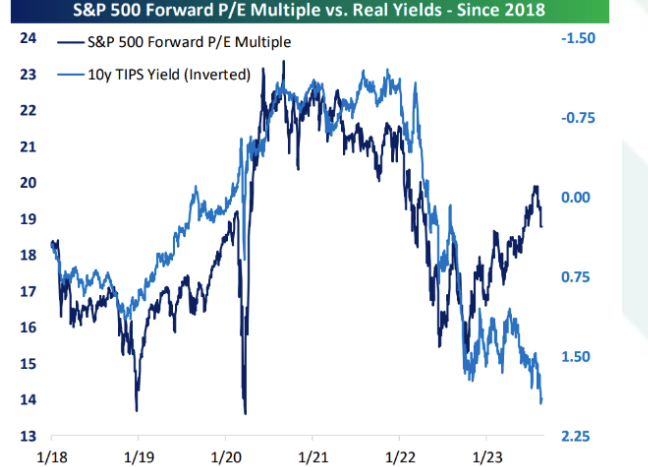
(Chart 2) Source: Bespoke Investment Group
The discrepancy in the performance of US equities and long-dated bonds defies easy explanation. The invention of ChatGPT and AI wave is certainly a catalyst… as is the resiliency of the US economy this year. However, ultimately, declining inflationary pressures have helped strength beget strength in the stock market.
The re-emergence of inflation remains the key risk to portfolios.
So, which asset class is right? Is the inflation genie really back in the bottle?
Is There Still Inflation Risk?
Many of the tailwinds that have pushed inflation lower this year have either receded or flipped. Higher energy prices, higher food prices, a weaker dollar, and fiscal loosening all set the stage for another bout of inflation. And falling inflation could even sow the seeds of its own demise. Consumption and real income growth are highly correlated. If inflation continues to fall, real wages will rise further. If that were to happen, the resulting increase in consumption could cause inflation to reaccelerate. As previously mentioned earlier in the year (Feb MIM), we discussed deflationary pressures for 2023 and that inflation is following a similar path to the 1970’s, where we saw a second surge of inflation. There are other structural forces like aging demographics providing tailwinds.
Therefore, we believe there is uncertainty over how quickly inflation will fall, and if it does fall, whether it will stay down. This against a backdrop of equities discounting a return to a “2% world”. We believe the US is not out of the woods when it comes to inflation, which means that it is too early to conclude that the Fed can stop raising rates. Any further increase in inflation risk would prompt us to turn more cautious on stocks. (Chart 3).
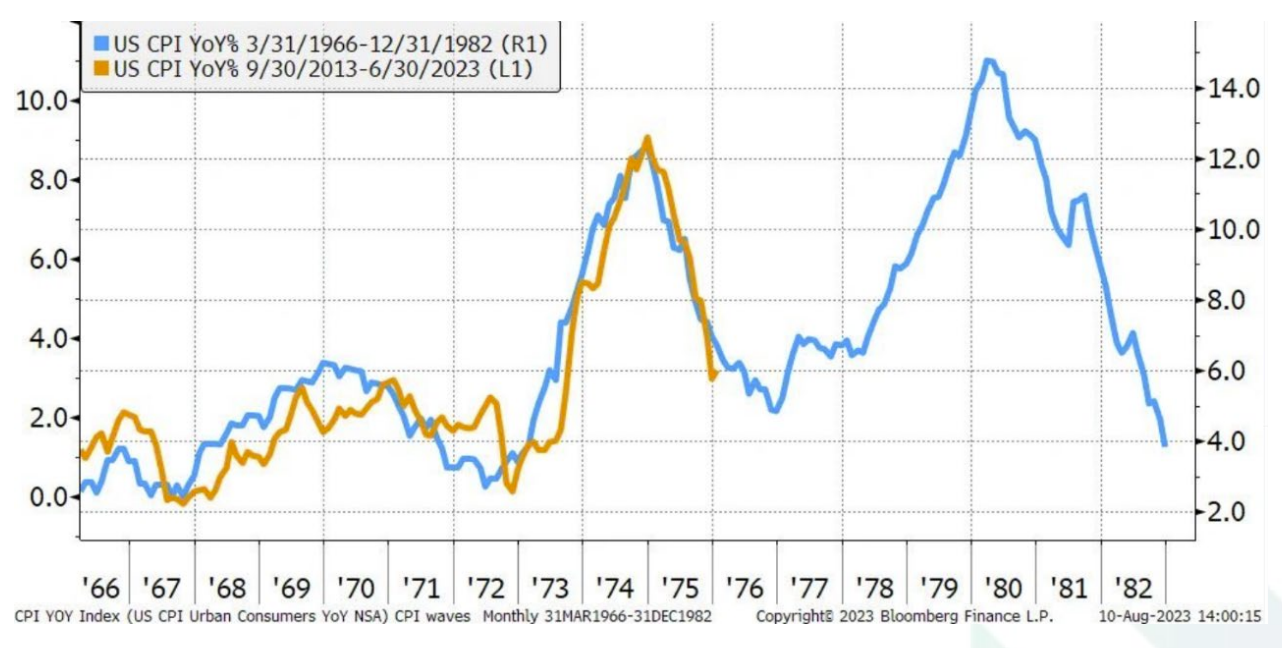
(Chart 3) Source: Bespoke Investment Group
Is There Still Recession Risk?
Given the normal range of “long and variable lags” between tightening financial conditions and recession ensuing, the US economy is not out of the woods. The yield curve inverted 300 days ago. On average, it has taken 589 calendar days for a recession to arrive after the curve first inverts. (Chart 4).
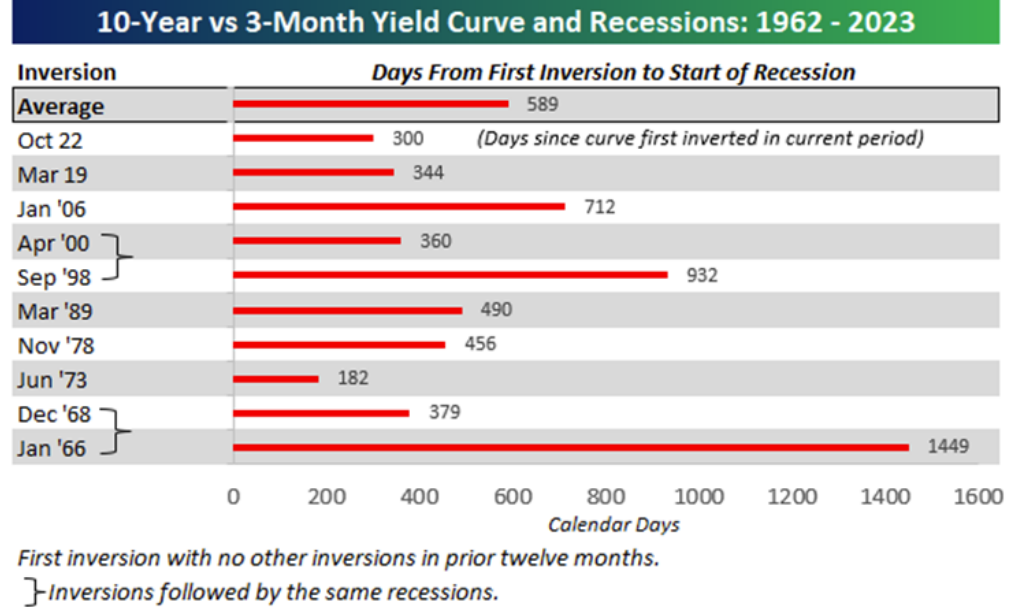
(Chart 4) Source: Bespoke Investment Group
Rarely do overshoots lead to soft landings. While recession has been pushed out, it is probably a question of when not if.
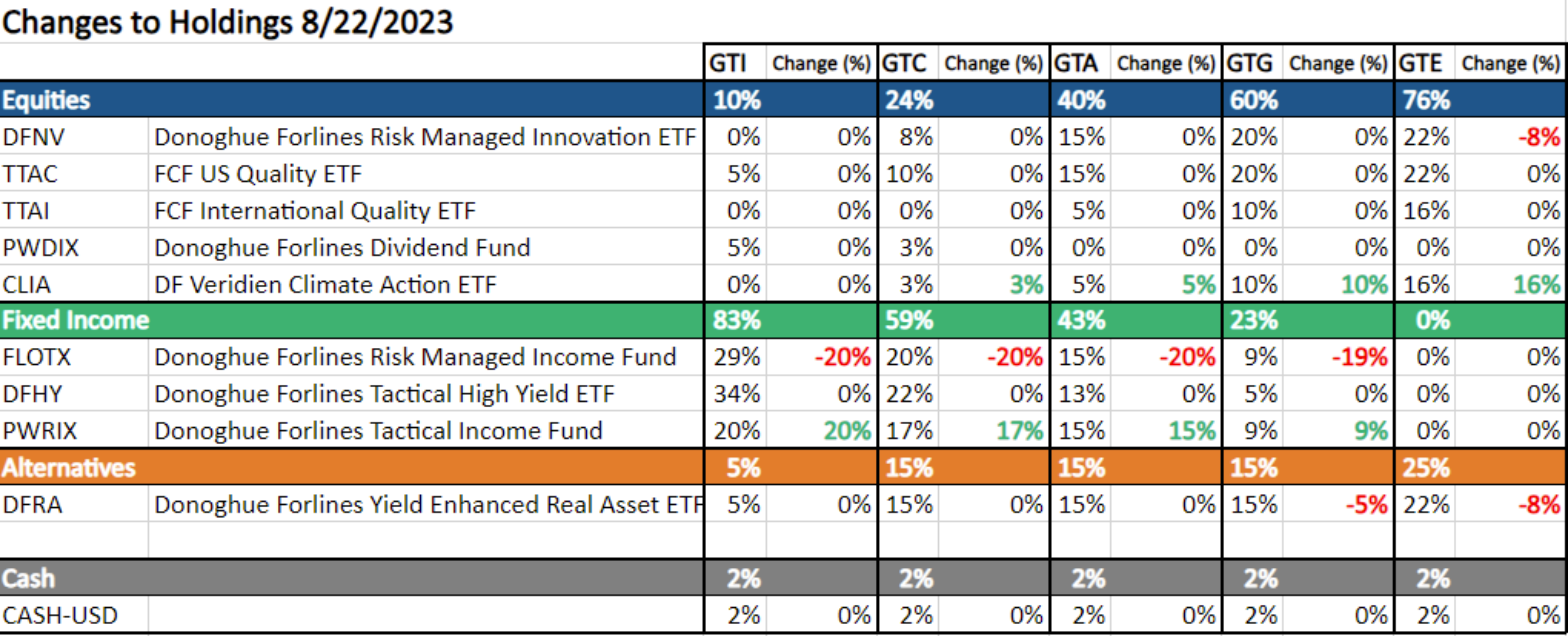
New Positions
Given market uncertainty, we have initiated a position in our tactical income fund within our models. Our fund currently holds a mix of high-quality low duration bonds that offer high risk-adjusted returns within the context of high short-term rates. It will also give us the flexibility to shift assets to longer duration bonds when fundamental elements change and other defensive assets to protect capital.
Additionally, we are using this pullback to leg into a new strategic position for our portfolios. We initiated a position in an active climate action fund. We believe climate change is both a major threat to global economies and a significant investment opportunity. Strong relative outperformance and an asymmetric risk profile can be achieved by investing in companies with decarbonization technologies and business models. Reducing greenhouse gas emissions and increased energy efficiency is driving new innovation and broad-based economic opportunity. In combination with our exposure to real assets, we believe we are aptly allocated for the present and future of energy consumption.
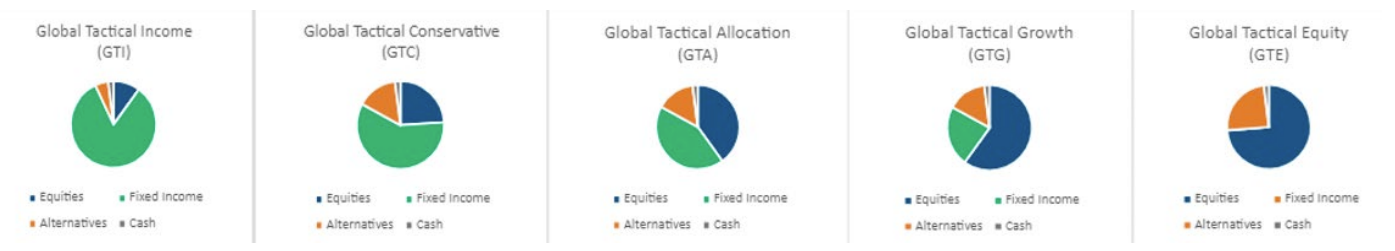
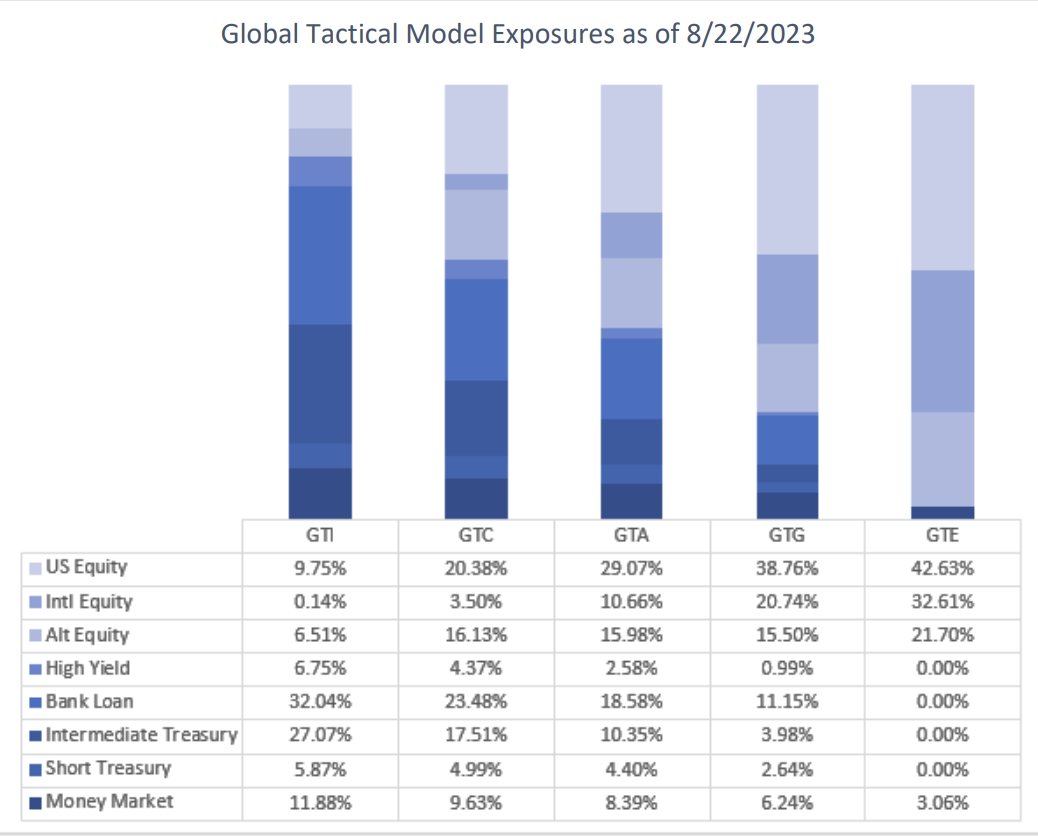
Overall, with mixed messages, our asset allocation is close to neutral. We will continue to monitor our portfolios as the facts change and will remain tactical as the situation evolves. We believe markets are at a point of inflection and will manage assets accordingly.
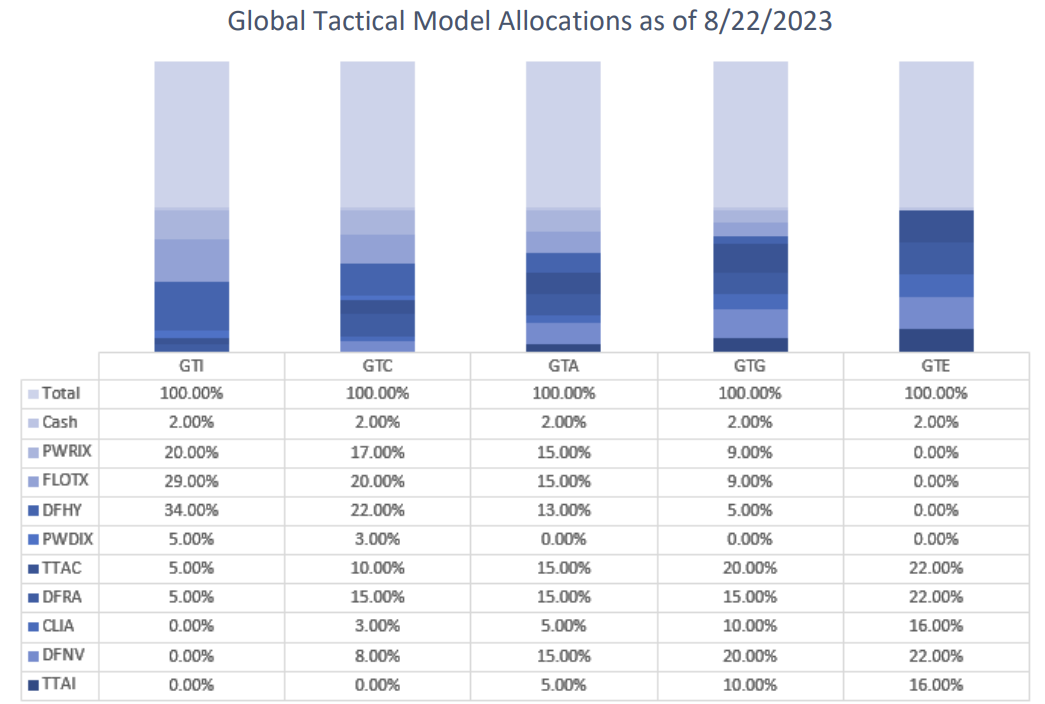
Recent Portfolio Changes
You can get more information by calling (800) 642-4276 or by emailing [email protected].
Best regards,
John A. Forlines III, Chief Investment Officer

Past performance is no guarantee of future results. Performance prior to January 1, 2018 was earned on accounts managed at a predecessor firm, JAForlines Global. The person primarily responsible for achieving that performance continues to manage accounts at Donoghue Forlines in a substantially similar manner. The material contained herein as well as any attachments is not an offer or solicitation for the purchase or sale of any financial instrument. It is presented only to provide information on investment strategies, opportunities and, on occasion, summary reviews on various portfolio performances. The investment descriptions and other information contained in this Markets in Motion are based on data calculated by Donoghue Forlines LLC and other sources including Morningstar Direct. This summary does not constitute an offer to sell or a solicitation of an offer to buy any securities and may not be relied upon in connection with any offer or sale of securities. The views expressed are current as of the date of publication and are subject to change without notice. There can be no assurance that markets, sectors or regions will perform as expected. These views are not intended as investment, legal or tax advice. Investment advice should be customized to individual investors objectives and circumstances. Legal and tax advice should be sought from qualified attorneys and tax advisers as appropriate. The calculation and presentation of performance has not been approved or reviewed by the SEC or its staff.
The Donoghue Forlines Global Tactical Allocation Portfolio composite was created July 1, 2009. The Donoghue Forlines Global Tactical Income Portfolio composite was created August 1, 2014. The Donoghue Forlines Global Tactical Growth Portfolio composite was created April 1, 2016. The Donoghue Forlines Global Tactical Conservative Portfolio composite was created January 1, 2018. The Donoghue Forlines Global Tactical Equity Portfolio composite was created January 1, 2018.
Results are based on fully discretionary accounts under management, including those accounts no longer with the firm. Individual portfolio returns are calculated monthly in U.S. dollars. These returns represent investors domiciled primarily in the United States. Past performance is not indicative of future results. Performance reflects the re-investment of dividends and other earnings.
Net 3% Returns
For all portfolios, net 3% returns are presented net of a hypothetical maximum fee of three percent (3%). Actual fees applicable to an individual investor’s account will wary and no individual investor may incur a fee as high as 3%. Please consult your financial advisor for fees applicable to your account.
Fee Schedule
The investment management fee schedule for all composites is: Client Assets = All Assets; Annual Fee % = 0.00%. Actual investment advisory fees incurred may vary and should be confirmed with your financial advisor
Each portfolio includes holdings on which Donoghue Forlines may receive management fees as the advisor and/or subadvisor or from separate revenue sharing agreements. Please see the prospectuses for additional disclosures.
The Donoghue Forlines Global Tactical Allocation Benchmark is the HFRU Hedge Fund Composite. The Blended Benchmark Conservative is a benchmark comprised of 80% HFRU Hedge Fund Composite and 20% Bloomberg Global Aggregate, rebalanced monthly. The Blended Benchmark Growth is a benchmark comprised of 80% HFRU Hedge Fund Composite and 20% MSCI ACWI, rebalanced monthly. The Blended Benchmark Income is a benchmark comprised of 60% HFRU Hedge Fund Composite and 40% Bloomberg Global Aggregate, rebalanced monthly. The Blended Benchmark Equity is a benchmark comprised of 60% HFRU Hedge Fund Composite and 40% MSCI ACWI.
The MSCI ACWI Index is a free float adjusted market capitalization weighted index that is designed to measure the equity market performance of developed and emerging markets. The HFRU Hedge Fund Composite USD Index is designed to be representative of the overall composition of the UCITS-Compliant hedge fund universe. It is comprised of all eligible hedge fund strategies; including, but not limited to equity hedge, event driven, macro, and relative value arbitrage. The underlying constituents are equally weighted. The Bloomberg Global Aggregate Index is a flagship measure of global investment grade debt from twenty-four local currency markets. This multi-currency benchmark includes treasury, government-related, corporate and securitized fixed-rate bonds from both developed and emerging markets issuers.
Index performance results are unmanaged, do not reflect the deduction of transaction and custodial charges or a management fee, the incurrence of which would have the effect of decreasing indicated historical performance results. You cannot invest directly in an Index. Economic factors, market conditions and investment strategies will affect the performance of any portfolio, and there are no assurances that it will match or outperform any particular benchmark.
Policies for valuing portfolios, calculating performance, and preparing compliant presentations are available upon request. For a compliant presentation and/or the firm’s list of composite descriptions, please contact 800-642-4276 or [email protected].
Donoghue Forlines LLC is a registered investment adviser with the United States Securities and Exchange Commission in accordance with the Investment Advisers Act of 1940. Registration does not imply a certain level of skill or training.
For more news, information, and analysis, visit the ETF Strategist Channel.
