
We have shown similar tables in previous updates, but Canterbury Ranks and Rates securities on a risk-adjusted basis according to our Volatility-Weighted-Relative-Strength (VWRS). It allows all securities to be put on an equal playing field when it comes to measuring relative strength in conjunction with volatility. Below is a table for the 11 S&P 500 sectors and their risk-adjusted strength.

Source: CIM
Looking at the table of US Sectors, along with their Canterbury Risk Adjusted Rank, you will notice that the Financial and Energy sectors are leading on a risk-adjusted basis. On the contrary, Consumer Discretionary and Technology have fallen significantly so far this year in ranking. Sector rankings can change quickly, and we would expect rotations to continue to occur. It is important to monitor for any changes in sector strength.
Value vs Growth
The chart below shows Large Cap Value versus Large Cap Growth so far this year. Growth stocks are mainly represented by technology. In 2021, value has been substantially outperforming growth, by about 10% year-to-date. This was not the case last year. As shown in the previous sector chart, Financials, Energy, and Industrials are largely value stocks and are the sectors showing strength. Technology-related stocks are largely growth. While growth stocks led last year, there has been a shift in leadership.
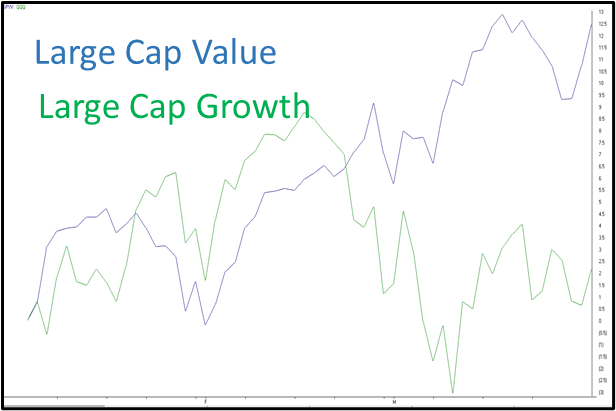
Source: AIQ Trading Expert Pro
Canterbury has identified 3 distinct market environments: Bull markets, Bear markets, and Transitional Markets. Each market environment has varying risk characteristics. Bull markets are less risky, whereas Bear markets have unlimited risk. Transitional markets fall somewhere in between: either risk is rising or falling.
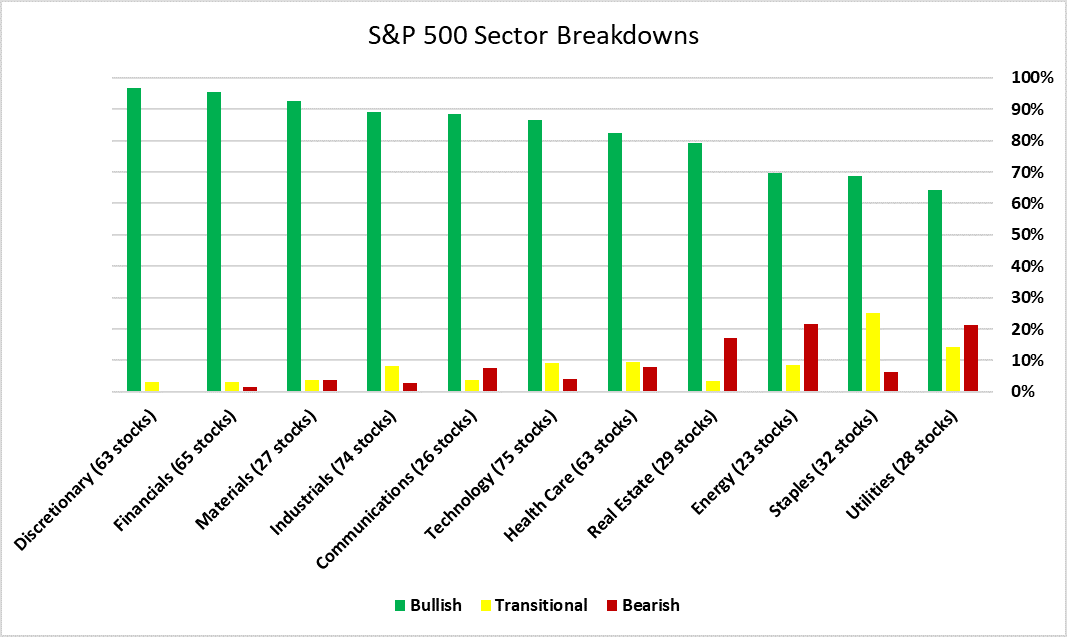
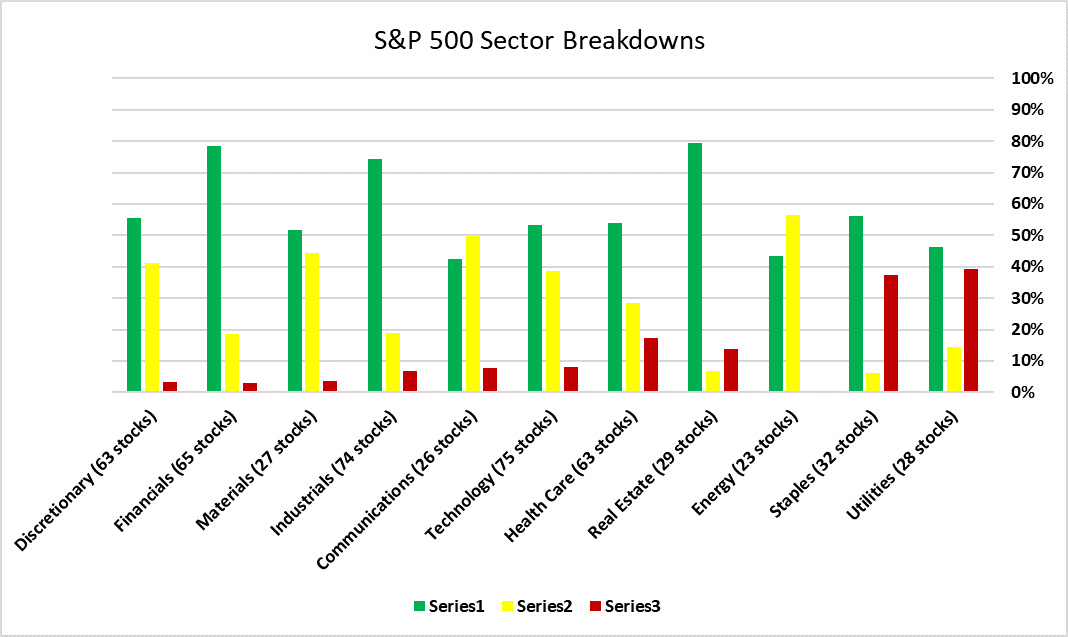
The two tables below show the percentage of stocks in each S&P 500 sector that are either Bullish, Bearish, or Transitional. The first chart is the percentages at the start of the year. The second chart is current percentages.
Sector Breakdowns As of December 31st, 2020
Sector Breakdowns as of March 26th, 2021
Here are a few points to be made regarding the two charts:
1) The market environment is changing. You can see from the start of the year through last Friday that there is a far less percentage of Bullish stocks within each sector, and a far greater percentage in transitional phases. A transitional state coming from a bullish state does not necessarily mean it will head towards being bearish. Oftentimes, these stocks re-enter a bullish state.
2) Financials, Industrials, and Real Estate have the highest percentage of Bullish stocks, while energy has no bearish stocks. This confirms our risk-adjusted sector rankings (real estate has been moving up in ranking).
3) Consumer Discretionary went from 97% Bullish to only 56%. In other words, we are starting to see some weakness and rotations within some tech-related sectors (Consumer Discretionary contains both Amazon and Tesla).
