
The title of last week’s update was “Markets will Fluctuate, That is a Fact.” Heading into last week, the S&P 500 had fluctuated down, to the tune of about -9% from the mid-August peak. This move had occurred over 15 trading days. Last week, however, the market saw a large fluctuation in the opposite direction, with the S&P 500 bouncing off some technical support and rallying +4%.
One indicator we quote often is AIQ Technical Analysis’ Expert Rating. The rating is a proprietary combination of technical indicators and provides an overbought/oversold reading. After the market’s downturn that spanned from August 16th through September 6th, the Expert Rating indicated that the market was 97% oversold. A reading above 95% is considered extreme, and therefore the market would most likely be due for a rally. After the rally last week, the Expert Rating surprisingly indicates that the S&P 500 is still 94% oversold. In other words, this rally could have a little steam left in it.
Of course, even if the rally continues, these short-term fluctuations in either direction are all a small part of the broader bear market. Bear Markets are characterized by high volatility and large swings that occur quickly and in both directions. We have shared this chart before, but the chart below shows the various large swings over short timeframes that the S&P 500 has experienced this year. The bottom third of the chart shows the Canterbury Volatility Index, which currently measures CVI 109. While volatility has come off of its peak, it remains high. As a reminder, volatility less than CVI 75 is considered low/safe. In other words, regardless of any potential move, this remains a bear market.
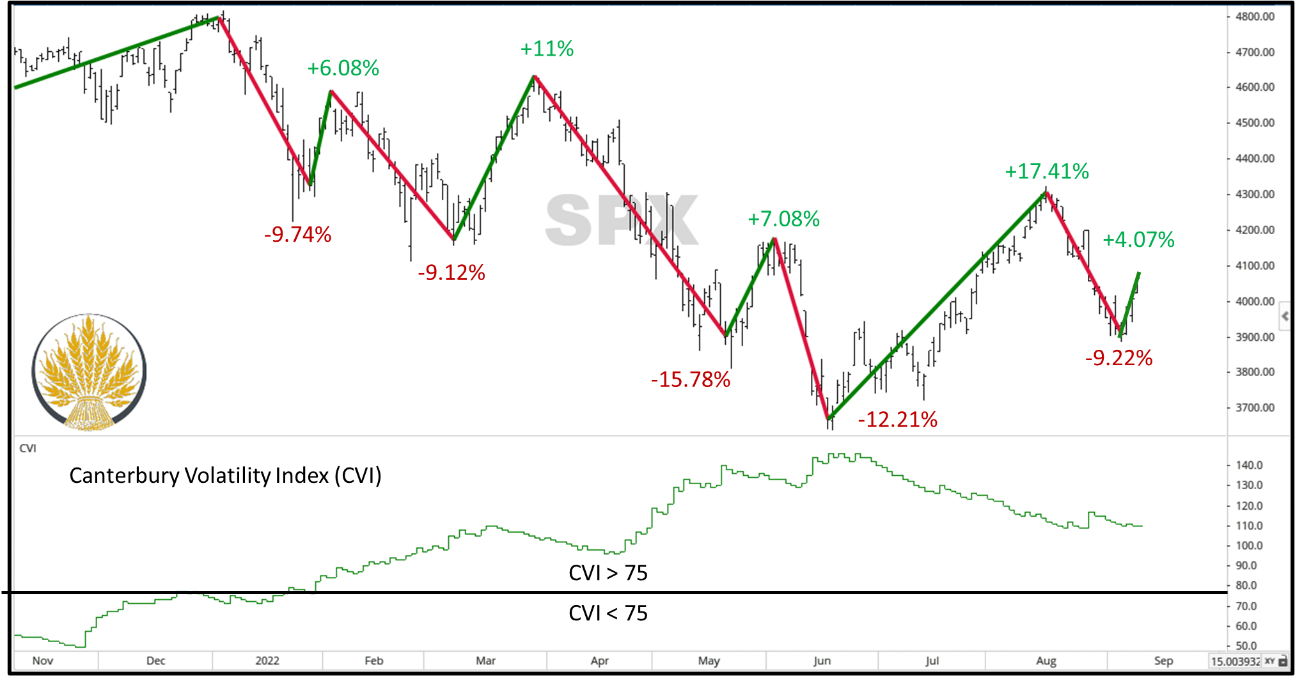
Source: Optuma Technical Analysis Charting Software
Global Markets
Currently, the number one ranked sector, on a risk adjusted basis, in Canterbury’s universe of ETFs, is the Utilities sector. The Utilities sector, which only makes up 3% of the S&P 500, is near an all-time high. Fundamentally, this may sound surprising. Investors generally buy Utilities stocks for their high yield. Because of their yield, Utilities can have a high correlation to the bond market, where rising rates would have a negative impact on Utilities since the higher rates would make a Utility stock’s yield less attractive. We know that rates are up, and bonds are in a bear market, with 20-year treasuries off more than -20% year-to-date and more than -30% from their 2020 peak. Yet, the Utilities sector is at a high, and has not been correlated to bonds in intermediate term. I am sure there is a “reason” for it, after all, Utilities are considered “defensive”, but then again, bonds are also considered “defensive,” yet are in a bear market unlike Utilities. This goes to show that correlations change over time, and supply & demand is the only law in markets.
The US markets may look bleak, but the broader markets have been worse off this year. The EAFE index, which tracks developed regions of Europe, Australia, Asia, and Far East, is down more than -20% year-to-date. Emerging Markets, which has most of its exposure in China, India, South Korea, and Taiwan is also down -20%.
The US dollar is currently at the top of Canterbury’s alternatives list, indicating that the dollar has been stronger than virtually every other global currency. Right now, the Dollar’s value relative to the Euro is at its highest level since 2002. The Dollar’s value relative to the Pound Sterling is at its highest level since 1985. It might not be a bad time to consider taking that European vacation.
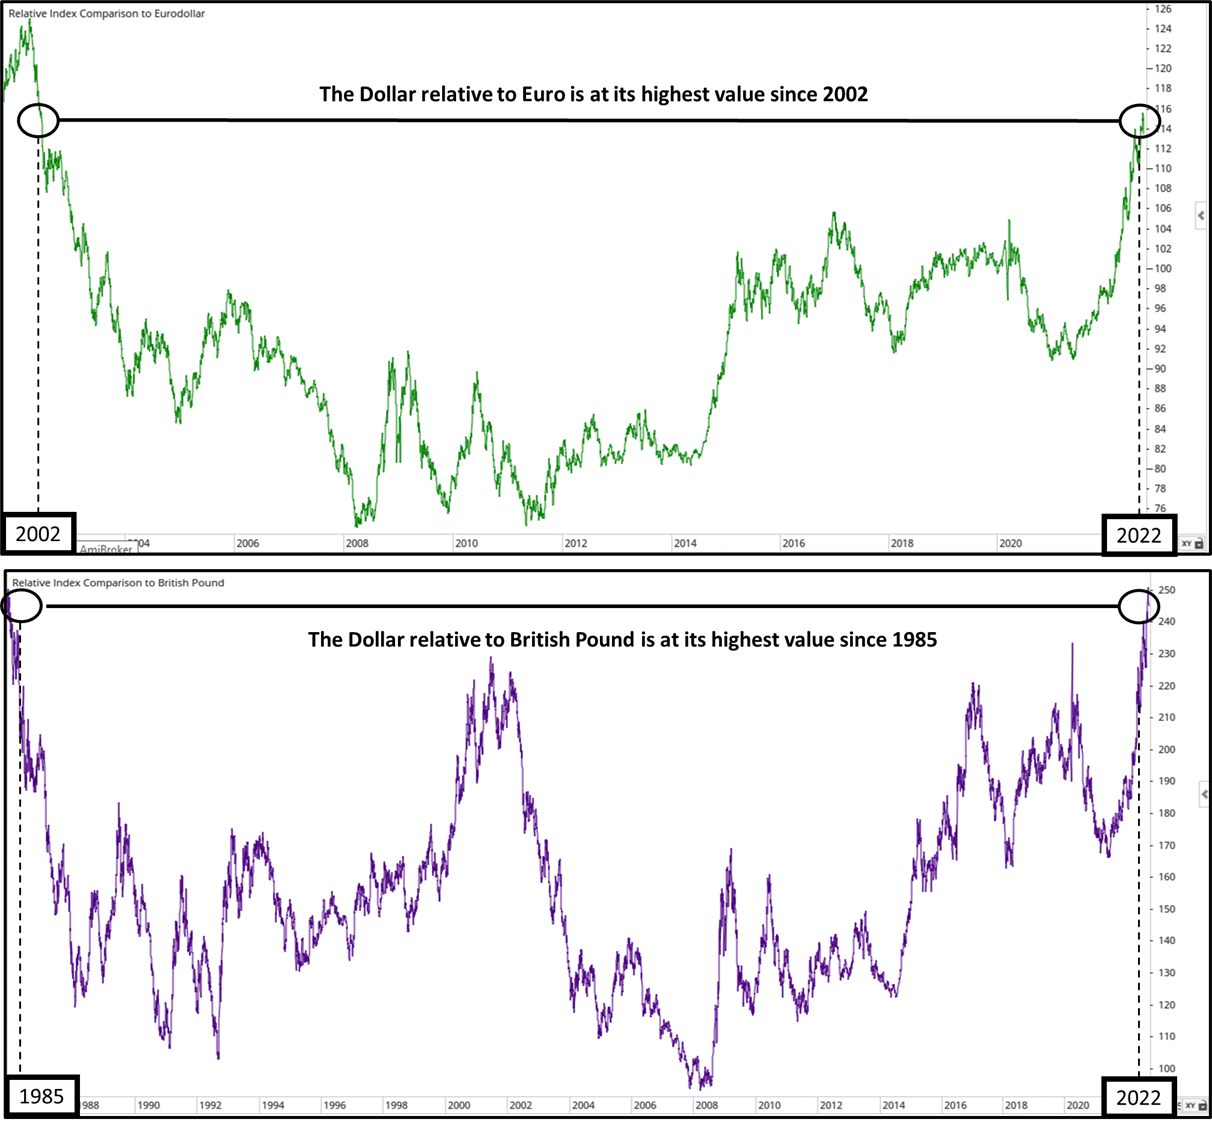
Source: Optuma Technical Analysis Charting Software, relative strength of the US Dollar to the Euro and Pound.
Bottom Line
The top three sectors right now, according to Canterbury’s risk adjusted rankings, are Utilities, Energy, and Consumer Staples. Collectively, these sectors account for a whopping 14% of the S&P 500. On the other hand, the bottom three ranked sectors are Communications, Information Technology, and Financials. Those three sectors make up 46% of the market index.
Expect large swings in the market to continue to happen. The recent uptick we have seen over the last week may have some momentum left in it, considering the broad market is still largely oversold, but do not let large upward fluctuations trick you into thinking the market is out of the woods just yet. Per the previously shown chart, the S&P 500 has seen rallies this year of both +11% and +17%, but also subsequent declines of -16%, -12%, and -9%.
The aim of adaptive portfolio management is to benefit from the market’s wide fluctuations instead of being punished by them. Every large decline requires a larger advance to put in a new high. Every bear market will eventually be followed by a bull market. The key to managing a portfolio is to limit the portfolio’s fluctuations and declines, in order to compound and take advantage of the market’s fluctuations.
For more news, information, and strategy, visit VettaFi.com.