
Weekly Update
We are now one week into the month of September. September is a historically weak month for the markets. As noted last week, September is the only month to have more negative returns than positive ones since 1950 (about 56% of September since 1950 have been negative).
Seasonality can certainly have an impact on the markets. As seen last month, August is typically a low-volume trading month. In this particular case, however, September being weaker is most likely a statistical anomaly and nothing more than a coincidence. The strength or weakness of a particular time frame, whether it be a day, month, year is largely dependent on a number of factors such as market volatility and market environment.
Sector Leadership
Gas prices have surged around the country. Whether it is a direct result or not, from a technical standpoint, the Energy sector is now the highest ranked S&P 500 sector on a risk adjusted basis (according to Canterbury’s Volatility-Weighted-Relative-Strength). While most sectors declined in August and in the first week of September, the Energy sector had a low correlation to the rest of the market and experienced an upward trend. The chart below shows the energy sector ETF (XLE) with a few technical notes.
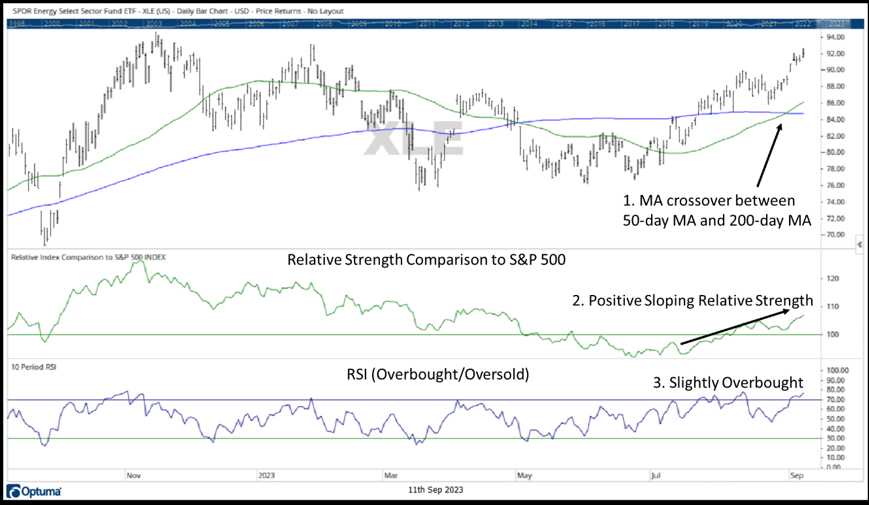
Source: Chart created by Canterbury Investment Management using Optuma Technical Analysis Software
A few comments:
- The 50-day moving average just crossed above the 200-day moving average. This is an indication of a positive trend.
- Relative Strength is upward sloping. This means that compared to the S&P 500, Energy has been outperforming on a relative basis (either on the upside or downside or both).
- RSI (overbought/oversold) is currently overbought. This is an indicator that measures the speed and magnitude of recent price changes. Right now, this indicator is showing that Energy is slightly overbought. Since Energy is overbought, it means that the sector has had a recent boost in momentum. This reading suggests that in the short term, there could be a slowdown in momentum or pullback to work off those overbought conditions, but the timing and extent of a potential pullback are unknown.
Technology Stocks
We have stated it many times this year, but the markets have largely been carried by technology-related stocks. The S&P 500 has significantly outperformed both the Dow Jones Industrial Average and the equal stock weighted S&P 500 this year, due to the S&P 500’s extreme skew towards large technology stocks. The largest eight technology-related stocks make up more than a quarter of the index’s market capitalization. That is 8 stocks, out of 505, making up 27% of the market index’s movements.
Each of the largest 8 stocks, which are Apple, Microsoft, Nvidia, Google (2 share classes), Amazon, Tesla, and Meta, are in the top 10% of S&P 500 performers this year. As a matter of fact, Nvidia, Meta, and Tesla are the top 3 S&P 500 performers in 2023 (these same stocks were some of the worst performers in 2022).
Although these large technology-related stocks are up significantly, more than half of the market’s components are flat or down on the year. The median S&P 500 stock is only up 2.9% year-to-date, and 45% of S&P 500 stocks are actually down. This puts the markets in a vulnerable position.
Bottom Line
Most of this year’s market performance has come from the S&P 500’s largest technology-related stocks. The largest 8 stocks are in the top 10% of market performers, and a few of them, which were among the worst performers in 2022, have been the very best stocks in 2023. While this is positive, the average S&P 500 stock is not doing nearly as well. The S&P 500 has outperformed the equal weight S&P 500 stock index by double digits.
The reason that this puts the market in a vulnerable position is because most of the index’s strength has been concentrated in just a few stocks. Just as these stocks have carried the market higher, they are also positioned to drag it down if they start to show signs of higher volatility. Markets have started to become a bit choppier lately.
For more news, information, and analysis, visit the ETF Strategist Channel.
