
Let’s imagine for a second that we have a time machine, and the date today is February 19th, 2020. The S&P 500 is at an all-time high and most markets are doing pretty well. We then use our time machine to flash forward 6 months. The S&P 500 is basically at the same place as it was back in February. All would seem to be fairly normal when just looking at the markets.
Now, we take a step outside. Everyone is wearing a face mask; in fact, you cannot even go into a grocery store without one. You see a report saying that nearly 3 quarters of a million people have passed away from a virus that has infected nearly 20 million people around the globe. Many small businesses had been forced to close for a few months due a virus, and some others located in major cities have been forcibly shut down due to social unrest. On top of all that, there is a Presidential election in less than 3 months and the campaigning has barely begun.
The last 6 months have forever paved the course of history in an interesting direction, having a major impact on the global economy. All-in-all, the S&P 500 is at the same spot as it was back in February, it just took a -34% drop in one month with no warning, followed by a huge rally with little or no pullbacks in between to get there. It’s a box of chocolates, you never know what you’re going to get, until you’ve already taken a bite.
S&P 500 Sectors
I do not want to beat a dead horse, but it is no secret that Technology is pulling this market. Canterbury has been saying it for awhile now, and it seems many of the major news outlets are also starting echo that fact as well. It is as if the Coronavirus pandemic has actually (substantially) helped technology-related companies, while seemingly bashing every other part of the economy and markets.
Sectors like Basic Materials (companies like Sherwin Williams, APD), and Consumer Staples (Walmart, P&G, Coca-Cola) are basically flat since February’s market highs. Healthcare is in that same boat, although has seen some of its technology-related industries (like medical devices) do well. Consumer Discretionary is up since February, but most of that comes from Amazon, which we know is basically technology. The average Consumer Discretionary stock is down about -8% this year. Looking at the Nasdaq, which is basically a composite of technology-related stocks, it is actually up substantially since February (+15%) and since the beginning of 2020 (+27%), by far and away leading the markets.
Meanwhile, several sectors that have a large impact on our economy, and also have little exposure to what we think of as technology have been struggling:
| Sector | % of February Market High |
| Financials | -20% |
| Energy | -32% |
| Industrials | -11% |
| Real Estate | -11% |
| Utilities | -12% |
Source: Koyfin Data on SPDR Sector ETFs
There is a lot of disparity in the markets, with some technology-related sectors far surpassing many other market segments. Why is the S&P 500 at nearly the same place it was 6 months ago? It is because it has a historically high exposure to technology-related stocks. Any shift or rotation in market strength could have a large impact on the overall markets.
Market Styles
This market drawdown and recovery has ironically been a story of growth. Many market pundits, Warren Buffett being one of them, talk about the success in buying Value stocks. The market we have seen has not told the same story. Growth has dominated, generally dropping less at the start of the pandemic, and since has rallied more.
The table below shows Canterbury’s risk adjusted rankings (which is a combination of momentum and volatility) for each of the investment “styles”. Large cap growth has led the way. Weirdly enough, large cap value is the laggard of the group:
| Style | Risk-Adjusted Ranking |
| Large Cap Growth | 1 |
| Mid Cap Growth | 2 |
| Small Cap Growth | 3 |
| Small Cap Value | 4 |
| Mid Cap Value | 5 |
| Large Cap Value | 6 |
Source: CIM
Keep in mind, that technology is by-and-large growth related. Most technology stocks are considered growth stocks. This matches up with what was said in the “sectors” part of this update.
Commodities
This year has also seen a rise in the strength of commodities. As the Fed continuously prints money to cover aid in response to the Coronavirus, there is the prospect of the dollar becoming weaker. Looking at a chart of the dollar ETF (Ticker: UUP), there is drop in price for the dollar:
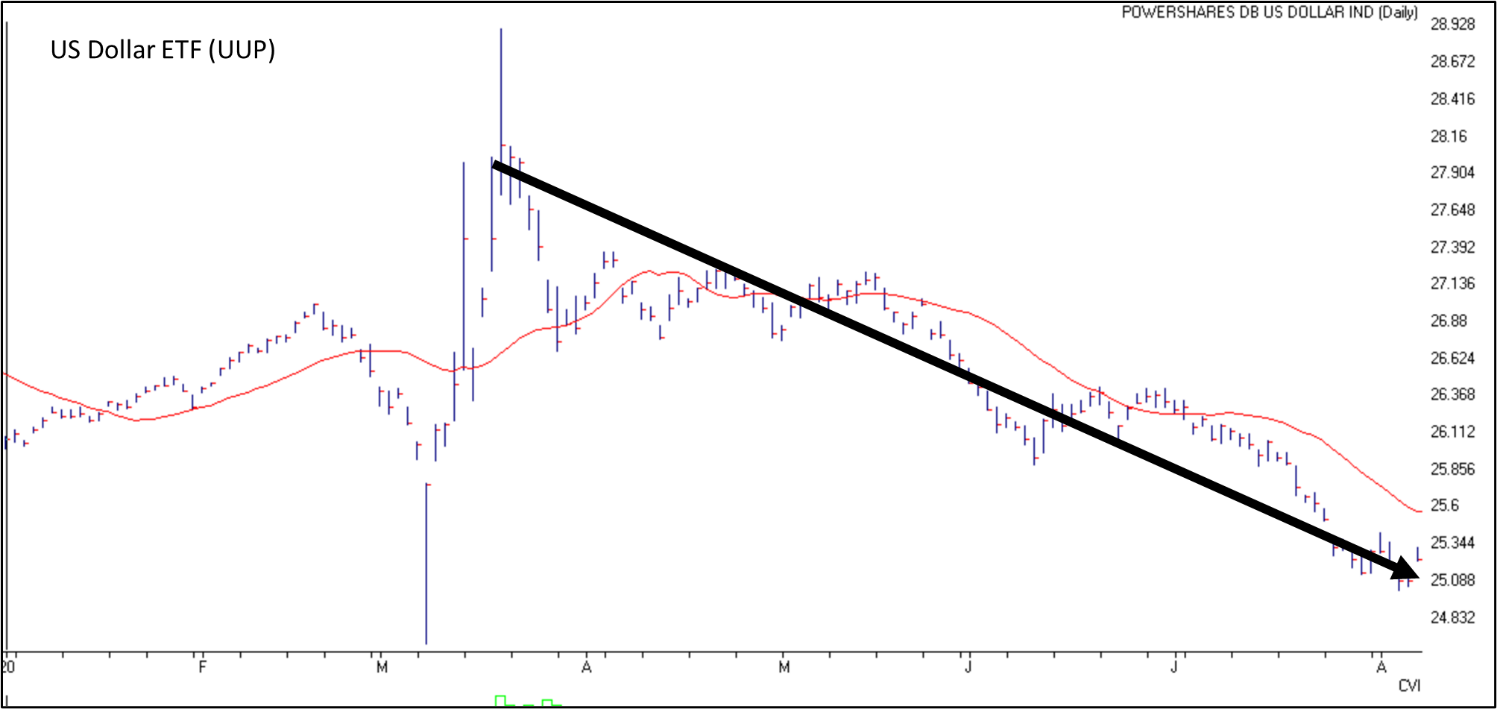
Source: AIQ Trading Expert
Gold and Silver, on the other hand, have seen substantial run-ups. Gold has been much more stable than silver. Silver has been weak for years now, but has formed a base. Since breaking out of that base, it has gone parabolic (the bigger the base, the higher in space):
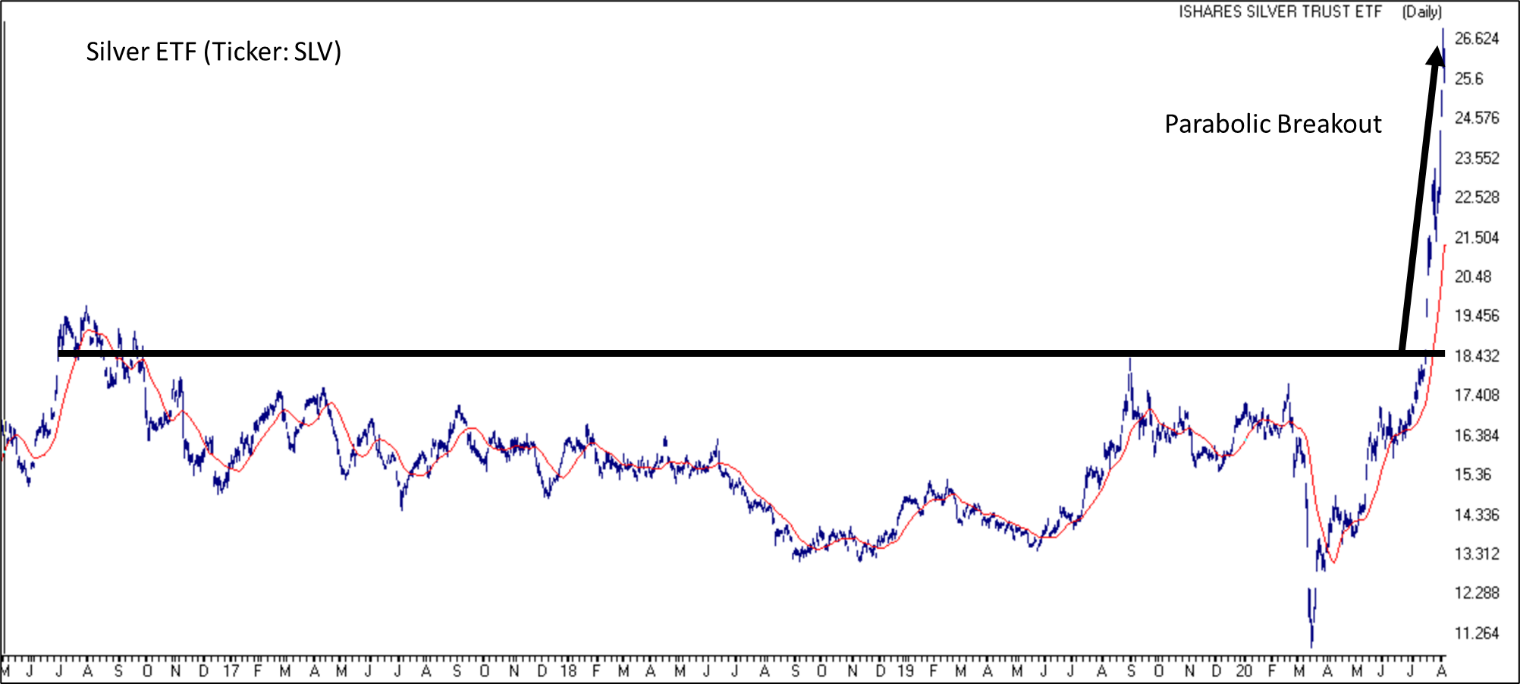
Source: AIQ Trading Expert
Bottom Line
The last 6 months have been strange for the markets. We saw some of the highest volatility ever experienced back in March, and it has since started to cool off but does remain high. As the equity markets approach their February highs, there would not be any reason to believe that they have the ability to stay there.
Market indexes were not built to be portfolios or even benchmarks; they were built to measure market capitalization. Right now, market capitalization tilts heavily towards technology. Technology related stocks make up a majority of the indices’ performance because of its substantial weight. Just as a note, the market does often have a way of balancing itself. For instance, the last time the S&P 500 had this much weight towards technology was back in 2000. After the tech crash, the market was much more balanced amongst the sectors. No telling when or if a technology correction will happen anytime soon, but in the type of environment we are in right now, it does have a higher-than-normal potential.
