

By Doug Sandler, CFA, Head of Global Strategy
SUMMARY
- We think the period from 1942-1966, sometimes referred to as ‘mid-century modern’, offers lessons we can learn from today.
- We see similarities in terms of technological progress, market fundamentals and geo-political instability.
- If we are right, stocks will likely remain above trend, returns will be more muted, and volatility will remain high
What was old may be new again, offering possible clues about the bull market’s next stages
The S&P 500 is on the brink of a cyclical (short-term) bear market, defined as a 20% decline from the previous high. However, we agree with Ned Davis Research (NDR) that it remains in a secular (long-term) bull market, one where stock prices rise at an above-average rate for an extended period and suffer only relatively short intervening declines. Given that history rarely repeats itself exactly, it does often rhyme, and we believe it makes sense to review prior secular bull markets to look for patterns that feel familiar. In our view, the most similar may be the secular bull market, which occurred between 1942 and 1966. Architects, designers, and fashionable Millennials may recognize that as the ‘mid-century modern’ period, which explains our title.
The 1942-1966 bull market progressed in two stages, as shown in the chart below. The first stage, which lasted 14 years (1942-1956) was defined by high returns where US Large-cap stocks rose from well-below trend to well-above trend. It was also a period of low interest rates. The second stage, where valuations started and ended above trend, lasted 10 years (1956-1966) and delivered more muted returns, as you can see from the chart. It is this second stage that we believe could provide some insight into how the next few years may unfold for US equity investors.
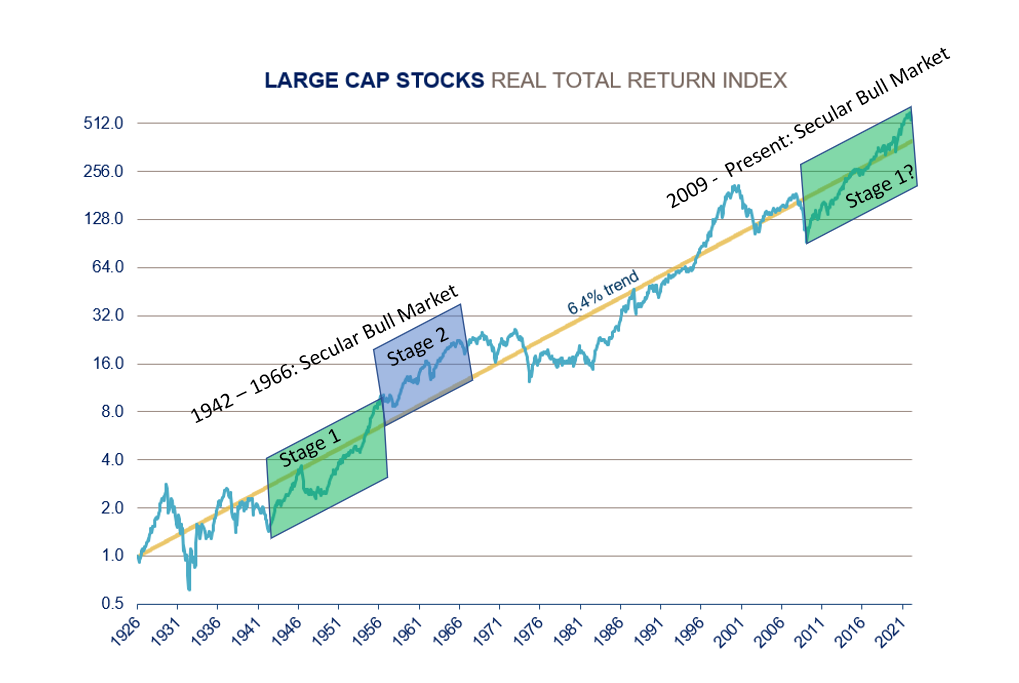
Source: RiverFront Investment Group, calculated based on data from CRSP 1925 US Indices Database ©2022 Center for Research in Security Prices (CRSP®), Booth School of Business, The University of Chicago. Data from Jan 1926 through Feb 2022. RiverFront’sPrice Matters® discipline compares inflation-adjusted current prices relative to their long-term trend to help identify extremes in valuation. Blue line represents the Large Cap Real Return Index. Yellow line represents the Annualized Real Trend Line of Large Cap Real Total Return Index according to Price Matters®. Information or data shown or used in this material was received from sources believed to be reliable, but accuracy is not guaranteed. The chart above uses a logarithmic scale. Line movements will be dampened/subdued based on the exponential y-axis. Chart shown for illustrative purposes only. Past performance is no guarantee of future results.
We believe that there were at least three defining characteristics of that second stage of the 1942-1966 secular bull market that share similarities with today’s investment environment. They include:
1) Innovation and economic progress,
2) Less favorable valuation and interest rate backdrops, and
3) Macro challenges and conflict.
Innovation and Economic Progress
Then:
- Innovation driving desire: 1950s and 1960s viewed as the beginning of the third industrial (digital) revolution – a period of revolutionary innovation that drove consumer desire and business investment. Some examples of these innovations include the first commercial computer (1951), first color TV broadcast (1954: Tournament of Roses Parade), first optical fiber (1956), Sputnik and the beginning of the space race (1957), first microchip (1958) and the first modern photocopier (1959). On a national level, the Federal government passed the Federal Highway Act in 1956, which established the interstate highway system. Like today, not all progress was viewed positively. Advancements like electronic data processing (EDP) and factory automation led to a condition the popular magazine The Nation referred to as ‘automation depression’ as many feared jobs being eliminated faster than they could be created.
- Demographics led spending boom/Establishment of consumer culture/birth of middle class: Pent-up consumption was unleashed after the war with returning veterans getting married, getting jobs, and buying cars, and homes (birth of suburbs). Amplifying the demand for goods and services was the birth of 71.6 million baby boomers.
Now:
- Another ‘Golden Age’ of Progress: Today, it is believed that we are at the dawn of the fourth industrial Revolution, which will be defined by technology actively intervening in more aspects of our life. This includes ‘life-improving’ tech such as self-driving cars, 3-D printing, and artificial intelligence.
- Demographic tailwind with Millennials in ‘prime spending’ years: The 72.1 million Millennials, have moved more slowly than prior generations when it comes to hitting major life milestones such as marriage, purchase of first home, and having children. They are now in their prime spending years and trying to catch up quickly, which we believe helps explain wedding venue bottlenecks and the low inventory of homes for sale. According to a 2016 report issued by the Census Bureau, only 24% of 25- to 34-year-olds had reached the four major life milestones: living on their own, holding a full-time job, getting married, and having children. In 1975, 45% of 25-to-34-year-olds had attained those milestones.
Less Favorable Valuation and Interest Rate Backdrop
Then:
- More expensive valuations: When the secular bull market began in April 1942, US Large-cap stocks were attractively valued at nearly 50% below trend, according to our Price Matters methodology. By the end of that bull market’s first stage (March 1956) stocks were more than 50% above trend and thus no longer cheap. However, stocks continued to rise in value throughout the bull market’s second stage, albeit at a slower pace, and peaked at roughly 90% above trend in October 1965.
- Rising rates: From 1942 to 1951 the Federal Reserve (Fed) kept interest rates artificially low, effectively pegging the Fed Funds rate at 0.375% and 10-year rates at 2.5%. After the peg was removed, rates were allowed to rise, and 10-year yields oscillated between 3% and 5% from April 1956 to February 1966.
Now:
- More expensive valuations: The first stage of the current secular bull market began with US large-cap stocks 47% below trend in February 2009. By December 2021 stocks had risen to 52% above trend.
- Rising rates: Except for a 3-year period, which ran from mid-2017 to mid-2020, the Fed has held the Fed Funds rate under 1% since the Financial Crisis of 2008. Over that time 10-year yields remained low, oscillating largely between 1% and 3%. Looking ahead, rates appear destined to rise above that range as the Fed restricts monetary policy to fight inflation.
Macro Challenges and Conflict:
Then:
- Economic Challenges: Despite real GDP growth of 3.8% between 1956 and 1966, the economy experienced two monetary policy-induced recessions in 1958 and 1960-1961.
- Social Division: The seeds of social division may have first been sown by Senator Joe McCarthy in the early 1950’s, with what has been labelled as McCarthyism or The Red Scare. Further division followed throughout the Civil Rights Movement, which lasted from 1954 to 1968.
- Geopolitical Conflict: Challenge and conflict defined this period as the Cold War with the Soviet Union intensified with the Cuban Missile Crisis (1962) and President Kennedy was assassinated in 1963.
Now:
- Economic Challenges: With high and persistent inflation, recession risk is currently rising – close to 70% and leading economists are now predicting a recession at some point next year, according to a recent article from the Financial Times.
- Social Division: It appears the partisan gap between progressives and conservatives is growing ever wider on a wide variety of social issues.
- Geopolitical Conflict: Eerily like the 1950s-60s, we believe the US is in the early stages of a new ‘Cold War’, this time with China; and the Ukraine War is again placing Russia’s transgressions in the global spotlight.
Conclusion:
It is from history that we can best understand how investors may respond to different market environments. Perfect correlations are rare, and unexpected factors could create some very different outcomes. However, we believe that the ‘mid-century modern’ bull market can offer some clues as to how the next leg of the current bull market unfolds. Assuming our views are correct, we see three take-aways investors should prepare for.
- Volatility is here to stay: Higher valuations, rising rates and a more caustic macro environment led to significant price volatility during the second stage of the ‘mid-century’ bull. We also anticipate heightened volatility in this next stage of the current bull market. Put more plainly, rising volatility means that stock markets will have more down days than investors have been used to. Rising volatility was one of our primary themes of our 2022 Outlook.
- Stocks and bonds more attractive but may not get cheap: US large-cap stocks remained relatively expensive throughout the second stage of the ‘mid-century’ bull, averaging nearly 57% above trend and remaining at least 18% above trend throughout, according to Price Matters. Bond yields were higher too, averaging 3.93%. Going forward we anticipate the normal ‘windows of opportunity’ where stock and bond valuations become temporarily more attractive but are not expecting the ‘fire sales’ that appeared after the Tech bubble or Financial Crisis of 2008.
- Lower, more normal returns on stocks, but still relatively attractive over time: Returns during the first stage of the ‘mid-century’ bull market were significant before normalizing in its second stage. We anticipate a similar path for returns in the current secular bull market, meaning that returns should be more normal (6-7% real returns) relative to the much higher returns experienced from 2009-2021.
- RiverFront Outcome Based Investment Solution Trends:
- Distribute: For the first time in a while, we believe ‘distribute’ investors could see reasonable yields from both the stock and bond portions of their portfolios. In our distribute portfolios we are staying balanced and ‘paying attention to the yields’ (PATTY) in our security selection. For more on PATTY read “Move over ‘TINA’… Here Comes ‘Patty’.
- Sustain: This could be a dangerous period for ‘sustain’ investors. During the more volatile environment the emotional impulse to abandon an investment plan will be greater. To counteract that urge, we have reduced the risk in our ‘sustain’-oriented portfolios by holding some extra cash, staying nimble and looking for opportunities.
- Accumulate: In our opinion, if the future is like the past, ‘accumulate’ investors should be very happy. When returns are normal and volatility is high, dollar-cost-averaging can be very effective. It can also be a good environment to pick up what could turn out to become some real bargains when the proverbial ‘baby’ gets ‘thrown out with the bathwater’. Our ‘accumulate’ portfolios are using times of high volatility to shop for bargains and put additional cash to work.
- Distribute: For the first time in a while, we believe ‘distribute’ investors could see reasonable yields from both the stock and bond portions of their portfolios. In our distribute portfolios we are staying balanced and ‘paying attention to the yields’ (PATTY) in our security selection. For more on PATTY read “Move over ‘TINA’… Here Comes ‘Patty’.
Important Disclosure Information:
The comments above refer generally to financial markets and not RiverFront portfolios or any related performance. Opinions expressed are current as of the date shown and are subject to change. Past performance is not indicative of future results and diversification does not ensure a profit or protect against loss. All investments carry some level of risk, including loss of principal. An investment cannot be made directly in an index.
Chartered Financial Analyst is a professional designation given by the CFA Institute (formerly AIMR) that measures the competence and integrity of financial analysts. Candidates are required to pass three levels of exams covering areas such as accounting, economics, ethics, money management and security analysis. Four years of investment/financial career experience are required before one can become a CFA charterholder. Enrollees in the program must hold a bachelor’s degree.
All charts shown for illustrative purposes only. Information or data shown or used in this material was received from sources believed to be reliable, but accuracy is not guaranteed.
This report does not provide recipients with information or advice that is sufficient on which to base an investment decision. This report does not take into account the specific investment objectives, financial situation or need of any particular client and may not be suitable for all types of investors. Recipients should consider the contents of this report as a single factor in making an investment decision. Additional fundamental and other analyses would be required to make an investment decision about any individual security identified in this report.
Index Definitions:
Standard & Poor’s (S&P) 500 Index TR USD (Large Cap) measures the performance of 500 large cap stocks, which together represent about 80% of the total US equities market.
Principal Risks:
Technical analysis is based on the study of historical price movements and past trend patterns. There are no assurances that movements or trends can or will be duplicated in the future.
Current yield is a bond’s annual return based on its annual coupon payments and current price (as opposed to its original price or face). The formula for current yield is a bond’s annual coupons divided by its current price.
In a rising interest rate environment, the value of fixed-income securities generally declines.
Definitions:
Stocks represent partial ownership of a corporation. If the corporation does well, its value increases, and investors share in the appreciation. However, if it goes bankrupt, or performs poorly, investors can lose their entire initial investment (i.e., the stock price can go to zero). Bonds represent a loan made by an investor to a corporation or government. As such, the investor gets a guaranteed interest rate for a specific period of time and expects to get their original investment back at the end of that time period, along with the interest earned. Investment risk is repayment of the principal (amount invested). In the event of a bankruptcy or other corporate disruption, bonds are senior to stocks. Investors should be aware of these differences prior to investing.
Ned Davis Research (NDR) is a global provider of independent investment research, solutions and tools. Founded in 1980, NDR helps clients around the world make objective investment decisions.
RiverFront’s Price Matters® discipline compares inflation-adjusted current prices relative to their long-term trend to help identify extremes in valuation.
Dollar-cost averaging (DCA) is an investment strategy in which an investor divides up the total amount to be invested across periodic purchases of a target asset in an effort to reduce the impact of volatility on the overall purchase. The purchases occur regardless of the asset’s price and at regular intervals.
For each outcome category (accumulate, sustain, and distribute) RiverFront’s portfolio management team has assigned one or more RiverFront product(s) based on their assessment of the product’s investment objective as it relates to a typical client’s return and risk objectives when seeking investment outcomes of accumulating wealth, sustaining wealth and distributing wealth. The team has also designated RiverFront product alternatives for those clients looking to take more or less risk with the outcome category. The ‘more aggressive’ (or more risk) alternatives will generally have greater equity and international exposure as well as longer time horizon targets, while those designated as ‘more conservative’ (or less risk) will have fewer equities, a lower exposure to international and shorter time horizon targets. Since the risk assessments are dependent on the outcome category selected,
RiverFront products may fall in multiple categories. All investments carry a risk of loss and there is no guarantee that an investment product or strategy will meet its stated objectives.
RiverFront Investment Group, LLC (“RiverFront”), is a registered investment adviser with the Securities and Exchange Commission. Registration as an investment adviser does not imply any level of skill or expertise. Any discussion of specific securities is provided for informational purposes only and should not be deemed as investment advice or a recommendation to buy or sell any individual security mentioned. RiverFront is affiliated with Robert W. Baird & Co. Incorporated (“Baird”), member FINRA/SIPC, from its minority ownership interest in RiverFront. RiverFront is owned primarily by its employees through RiverFront Investment Holding Group, LLC, the holding company for RiverFront. Baird Financial Corporation (BFC) is a minority owner of RiverFront Investment Holding Group, LLC and therefore an indirect owner of RiverFront. BFC is the parent company of Robert W. Baird & Co. Incorporated, a registered broker/dealer and investment adviser.
To review other risks and more information about RiverFront, please visit the website at www.riverfrontig.com and the Form ADV, Part 2A. Copyright ©2022 RiverFront Investment Group. All Rights Reserved. ID 2242673