

By Adam Grossman, CFA Global Equity CIO, Co-Head of Investment Committee and Dan Zolet, CFA, Associate Portfolio Manager
SUMMARY
- Recent inflation was higher than expected, but forward expectations remain anchored, in our view.
- We think elevated inflation will support earnings.
- With this backdrop, we believe large tactical moves become potentially treacherous.
It Feels Like the Sky Is Falling, but One Data Point Is Not Predictive of Future Conditions
In the book “Alexander and the Terrible, Horrible, No Good, Very Bad Day” by Judith Viorst, a favorite amongst RiverFront’s Investment Team (and some of our children), a central theme is that bad days (or weeks in this case) do occur and must be dealt with, but they do not define our long-term reality. Tuesday’s Consumer Price Index (CPI) print is a good opportunity to apply this wisdom to our investing methodology. The inflation data was a setback whose short-term impact was felt immediately; however, its longer effects are less obvious. When looking under the hood of the CPI report, there are some particularly concerning trends in the housing costs. We believe this number weighed heavily on markets because housing tends to be a stickier component of inflation, in our view. To make a bad week worse, logistics company [1] preannounced large earnings misses and withdrew its fiscal year outlook, citing high costs and a slowing global economy. While some of FedEx’s issues may be company-specific, we believe the miss could also be seen as a harbinger of global recession given FedEx’s status as one of the world’s largest shipping and logistics companies. The S&P 500 posted its worst week since June with a fourth decline in the past five , including weakness Friday that took the index slightly below the 3900 level of technical support we laid out in the Weekly View: The Fed, The Fears, and The Facts two weeks ago.
Understanding the Ripple Effects of CPI
Given that Jerome Powell and the Federal Reserve (Fed) have been perfectly clear that the inflation side of the Federal Reserve’s dual mandate is more important to them right now than full employment, last week’s CPI number meaningfully adjusted the market’s expectations for the Fed’s policy decision. Using Federal Fund Rate futures, we believe it is possible to calculate the market’s imbedded expectations for future Fed actions. Prior to last Tuesday’s August 2022 data release, the market’s prediction for the September 21st Federal Open Market Committee (FOMC) meeting was a hike of 75 with a probability of %. After last week, the market is now still expecting a 75-bps hike, but with only a 69% . The major difference between these two predictions is that prior to the data release, the market was expecting virtually no chance of a 100-basis-point hike, while now that number has climbed to 31%.
From the fixed income futures market reaction, we can begin to see the concerns behind the equity market’s drawdown. If the Fed follows a path which involves more hiking of their policy rate, growth-oriented securities such as equities tend to lose intrinsic value using the discount rate. Put simply, the discount rate is a measure of the opportunity cost of investing in a stock and is used when valuing equities to put future earnings power into current terms. Since this discount rate is highly correlated with interest rates, when the Fed increases the rate, they also put downward pressure on the equity market. The more that the intrinsic value of a particular stock is tied to long-term expectations of above-average growth, the more forceful the downward pressure is on valuation. Hence, speculative growth stocks have seen the strongest downside price momentum this year.
Inflation Now Vs. Later: Not Losing the Forest Through the Trees
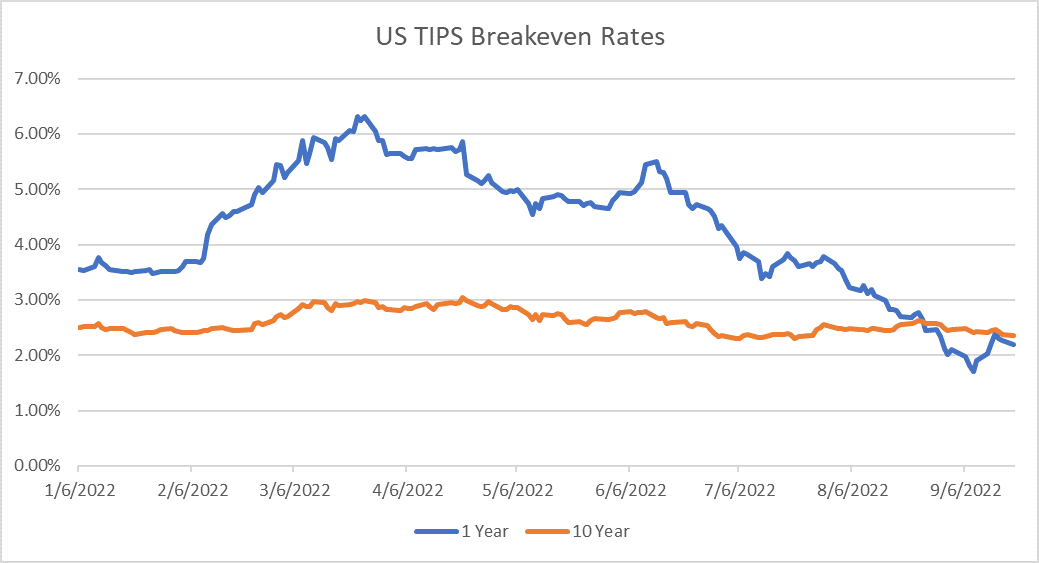 While the concerns stated above are very real and we believe will likely lead to volatility in both the fixed income and equity markets in the short term, it is important to not lose sight of long-term investment prospects. One way to monitor the fixed income market’s longer term inflation expectations is through something called US Treasury Inflation-Protected Securities (TIPS) breakeven rate. The TIPS breakeven rate is the difference in yield between the inflation protected security (the TIP) and the regular Treasury bond. This difference can be thought of as the bond market’s collective future expectation of inflation. Figure 1 is a 1- and 10-year view of inflation based on this metric. While the 1-year expectation for inflation (the blue line) ticked up on the August inflation print, its level is muted compared to earlier this year. Additionally, while long-term inflation expectations (the orange line) are above Chairman Powell’s stated goal of %, one can see that they remain relatively tame. We believe this signals that the bond market is expecting long term inflation to be brought under control through a combination of Fed actions already taken, as well as those that are already factored into Wall Street’s expectations. Additionally, we believe supply chain improvements will help ease inflationary pressures.
Earnings: Slowing but Still Growing
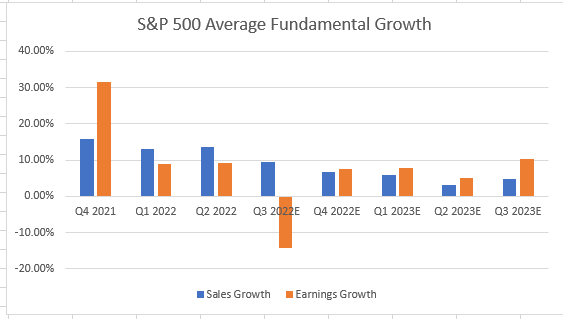
The bar chart (left) illustrates realized annual growth of sales and revenue by quarter through present time, as well as analyst expectations of future growth. While growth is expected to slow in the coming quarters vs 2021 (something we anticipate as well), its forcast remains positive for three out of the next four quarters. This comes despite significant revisions downward in recent months. In our 2022 Outlook we pointed to some analysis that suggests higher-than-average inflation historically has been correlated with higher-than-average corporate earnings, particularly for companies who can successfully pass higher costs onto their end markets. Thus, we believe that earnings in nominal terms will remain resilient in the back half of 2022. We would also point out that the current pessimism in the markets identified in last week’s Weekly View: Tactical Rules Are Mixed But Waving The Caution Flag means it is likely that extremely pessimistic sentiment is weighing on these estimates.
Implications for Portfolios: Hope is Not a Strategy, but Neither is Fear
In conclusion, we believe that the negative sentiment caused by the Fed’s pivot earlier this year, COVID-19’s lingering effect on supply chains and the war in Ukraine has caused an environment where each bit of bad news can make it feel like the sky is falling. While the short-term inflation and growth data have been challenging, it is important to remember that a single data point is not necessarily predictive of future conditions. While we see some reasons for the market to remain bearish short-term, we think earnings are strong enough at present to make a further market pullback difficult to trade successfully.
For investors with a shorter time horizon, short-term volatility is a bigger concern. Therefore, our shorter horizon portfolios, which tend to be more risk-adverse, maintain a slight underweight positioning to both equities and interest rate sensitivity. The shorter-horizon portfolios also maintain a slight overweight to cash for tactical flexibility and as a risk ‘shock absorber’. We may look to reinvest cash opportunistically by extending maturities on the fixed income side.
For investors with a longer time horizon, short-term volatility cannot be ignored but should not trump long-term opportunities and themes. To this end, our longer horizon, more risk-tolerant portfolios are roughly neutral to equities with a higher portfolio yield than benchmarks. In these portfolios, we maintain a focus on security selection as well as risk mitigation through alternative yield strategies and foreign currency hedging. While currently a volatile asset class, we believe the yield advantages will outweigh this volatility over time. On the equity side, we maintain an underweight to consumer themes and an overweight to sectors such as energy and high-quality technology, very different business models whose earnings nonetheless we believe can continue to grow against an inflationary backdrop.
[1]RiverFront does not have any exposure to FedEx (FDX) in any of its portfolios or sub-advised ETFs or mutual funds.
Important Disclosure Information:
The comments above refer generally to financial markets and not RiverFront portfolios or any related performance. Opinions expressed are current as of the date shown and are subject to change. Past performance is not indicative of future results and diversification does not ensure a profit or protect against loss. All investments carry some level of risk, including loss of principal. An investment cannot be made directly in an index.
Information or data shown or used in this material was received from sources believed to be reliable, but accuracy is not guaranteed.
This report does not provide recipients with information or advice that is sufficient on which to base an investment decision. This report does not take into account the specific investment objectives, financial situation or need of any particular client and may not be suitable for all types of investors. Recipients should consider the contents of this report as a single factor in making an investment decision. Additional fundamental and other analyses would be required to make an investment decision about any individual security identified in this report.
Chartered Financial Analyst is a professional designation given by the CFA Institute (formerly AIMR) that measures the competence and integrity of financial analysts. Candidates are required to pass three levels of exams covering areas such as accounting, economics, ethics, money management and security analysis. Four years of investment/financial career experience are required before one can become a CFA charterholder. Enrollees in the program must hold a bachelor’s degree.
All charts shown for illustrative purposes only. Technical analysis is based on the study of historical price movements and past trend patterns. There are no assurances that movements or trends can or will be duplicated in the future.
Index Definitions:
Standard & Poor’s (S&P) 500 Index measures the performance of 500 large cap stocks, which together represent about 80% of the total US equities market.
The Consumer Price Index (CPI) is a measure that examines the weighted average of prices of a basket of consumer goods and services, such as transportation, food, and medical care. It is calculated by taking price changes for each item in the predetermined basket of goods and averaging them. Changes in the CPI are used to assess price changes associated with the cost of living. The CPI is one of the most frequently used statistics for identifying periods of inflation or deflation.
A basis point is a unit that is equal to 1/100th of 1%, and is used to denote the change in a financial instrument. The basis point is commonly used for calculating changes in interest rates, equity indexes and the yield of a fixed-income security. (bps = 1/100th of 1%)
Stocks represent partial ownership of a corporation. If the corporation does well, its value increases, and investors share in the appreciation. However, if it goes bankrupt, or performs poorly, investors can lose their entire initial investment (i.e., the stock price can go to zero). Bonds represent a loan made by an investor to a corporation or government. As such, the investor gets a guaranteed interest rate for a specific period of time and expects to get their original investment back at the end of that time period, along with the interest earned. Investment risk is repayment of the principal (amount invested). In the event of a bankruptcy or other corporate disruption, bonds are senior to stocks. Investors should be aware of these differences prior to investing.
Treasury Inflation Protected Securities (TIPS) are Treasury securities that are indexed to inflation in an effort to protect investors from the negative effects of inflation. The principal value of TIPS is periodically adjusted according to the rate of inflation as measured by the Consumer Price Index (CPI), while the interest rate remains fixed. TIPS will decline in value when real interest rates rise. Portfolios that invest in TIPS are not guaranteed and will fluctuate in value.
The federal funds rate is the target interest rate set by the Federal Open Market Committee (FOMC). This is the rate at which commercial banks borrow and lend their excess reserves to each other overnight.
When referring to being “overweight” or “underweight” relative to a market or asset class, RiverFront is referring to our current portfolios’ weightings compared to the composite benchmarks for each portfolio. Asset class weighting discussion refers to our Advantage portfolios.
Investments in international and emerging markets securities include exposure to risks such as currency fluctuations, foreign taxes and regulations, and the potential for illiquid markets and political instability.
High-yield securities (including junk) are subject to greater risk of loss of principal and interest, including default risk, than higher-rated securities.
Technology and Internet-related stocks, especially of smaller, less-seasoned companies, tend to be more volatile than the overall market.
RiverFront Investment Group, LLC (“RiverFront”), is a registered investment adviser with the Securities and Exchange Commission. Registration as an investment adviser does not imply any level of skill or expertise. Any discussion of specific securities is provided for informational purposes only and should not be deemed as investment advice or a recommendation to buy or sell any individual security mentioned. RiverFront is affiliated with Robert W. Baird & Co. Incorporated (“Baird”), member FINRA/SIPC, from its minority ownership interest in RiverFront. RiverFront is owned primarily by its employees through RiverFront Investment Holding Group, LLC, the holding company for RiverFront. Baird Financial Corporation (BFC) is a minority owner of RiverFront Investment Holding Group, LLC and therefore an indirect owner of RiverFront. BFC is the parent company of Robert W. Baird & Co. Incorporated, a registered broker/dealer and investment adviser.
To review other risks and more information about RiverFront, please visit the website at www.riverfrontig.com and the Form ADV, Part 2A. Copyright ©2022 RiverFront Investment Group. All Rights Reserved. ID 2431634