
By Chris Konstantinos, Director of Investments, Chief Investment Strategist
SUMMARY
- Recession fears are rampant.
- However, our ‘Recession Dashboard’ tells a different story.
- Six of seven indicators suggest the US economy will continue to grow, in our view.
Our Recession Dashboard’: Seven Indicators to Watch Going Forward
As inflation rages and interest rates move higher, equity markets have felt more pain than the economy. Despite the continued reassurances provided by the monthly economic data releases, worries are mounting that higher prices and borrowing costs will extinguish economic growth. Add to that the growing number of forecasters warning of a US economic downturn, and it is understandable that the question we get most often has become “Is the US headed into a recession?” We think not.
Last week, we focused on recession-tracking primary US economic indicators used by the National Bureau of Research (NBER) Weekly View 5.31.22), which maintains a chronology of US business cycles. This week we augment the NBER’s list with our own ‘Recession Dashboard,’ a partial list of indicators we have found, in our experience, to be useful recession predictors. No single indicator is infallible; however, taken in aggregate we believe these provide a robust estimation of future recession risks. Shaded regions on the charts below denote historical recessions; each indicator we show has data dating back to at least the 1970s.
Source: Refinitiv Datastream, RiverFront. Data monthly as of May 2022. Chart shown for illustrative purposes.
Our conclusion today is the same as last week, in that the weight of this evidence does not suggest an imminent recession. Nonetheless, we are diligently monitoring economic output for signs of further cracks, particularly in consumer confidence. At RiverFront, we believe in ‘Process over Prediction,’ which means our portfolio positioning is built to adapt as data changes, and thus not predicated solely on accurately forecasting future events such as the next economic downturn.
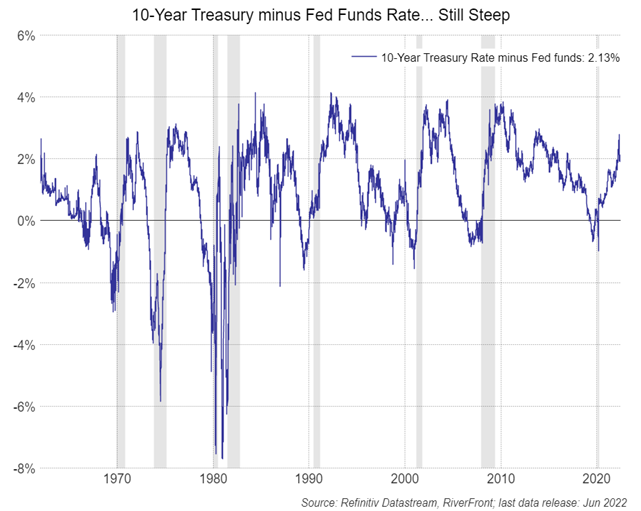
Yield curve: Positive – Not Flashing Warning Yet
The difference between 10-year Treasury and Federal Funds (Fed Funds) yields -aka the ‘yield curve’- is still positive as 10-year yields are higher (see chart, previous page). An ‘inverted’ yield curve (10-year yields lower than Fed Funds) has historically been a reliable signal of impending recession, in our view. After the 10yr-Fed Funds curve inverts, a recession typically starts a year later.
Source: Refinitiv Datastream, RiverFront. Data monthly as of May 2022. Chart shown for illustrative purposes.
Since the yield curve is still positive and steepening (see chart, left), we view this as a positive sign that a recession is not imminent.
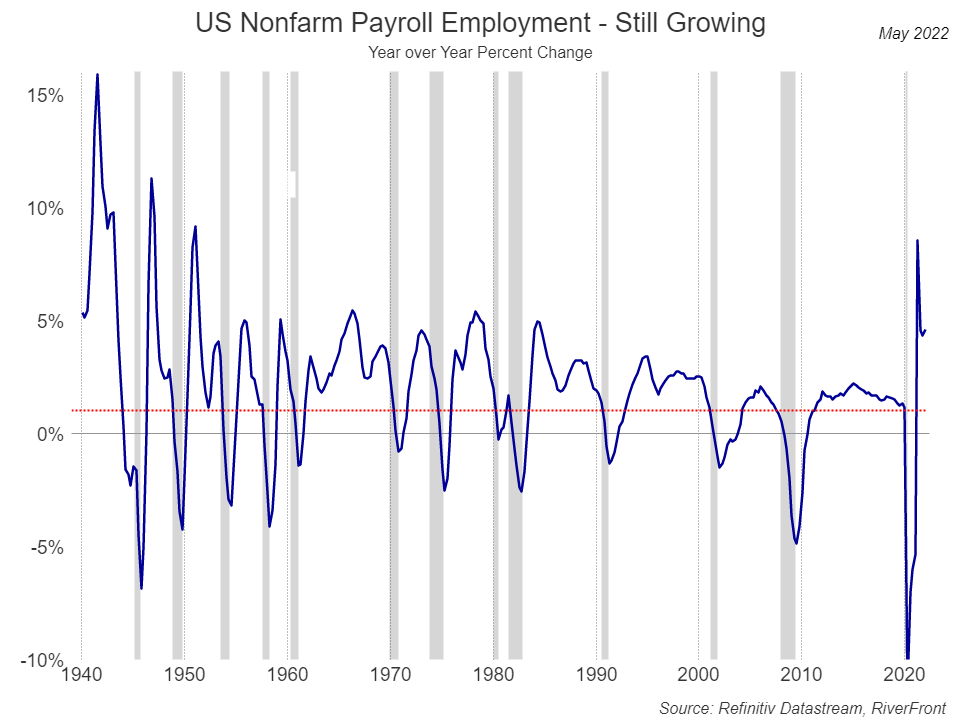
Change in Payrolls:
Slowing in employment trends can give important warning signals concerning the health of the economy. In our experience, a slowing of payroll growth at or below 1% tend to presage recession. Currently, payrolls are growing about 5% year-over-year, and recently reversed back up.
Source: Refinitiv Datastream, RiverFront. Data monthly as of May 2022. Chart shown for illustrative purposes.
Unemployment: Other employment-related signals we like to follow include the ‘Sahm Rule’[1], which is triggered when the three-month moving average of the national unemployment rate rises by at least 0.5% percentage points or more relative to its low during the previous 12 months. Similar to payrolls, this indicator is also in a constructive zone in our opinion.
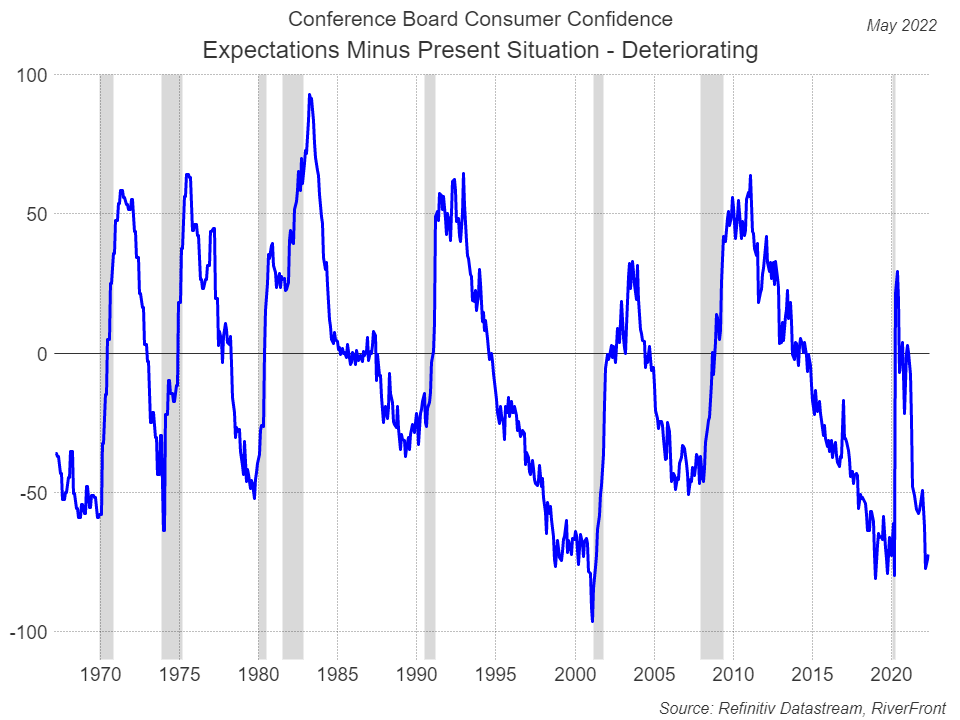
Consumer Confidence: Negative – Confidence Clearly Slipping
The psyche of the US consumer is important, given that consumer spending represents a significant portion of our economy.
A large drop in the difference between the Conference Board’s Consumer Expectations Index and the Present Situation Index usually precedes recession (see chart, right).
We believe, this is arguably the only concerning data point in our ‘dashboard’. Currently, it is near levels that have suggested recession in the past. We will continue to monitor health of the consumer closely from here.
Construction Spending and Heavy Truck Sales: Positive – Data Remains Strong
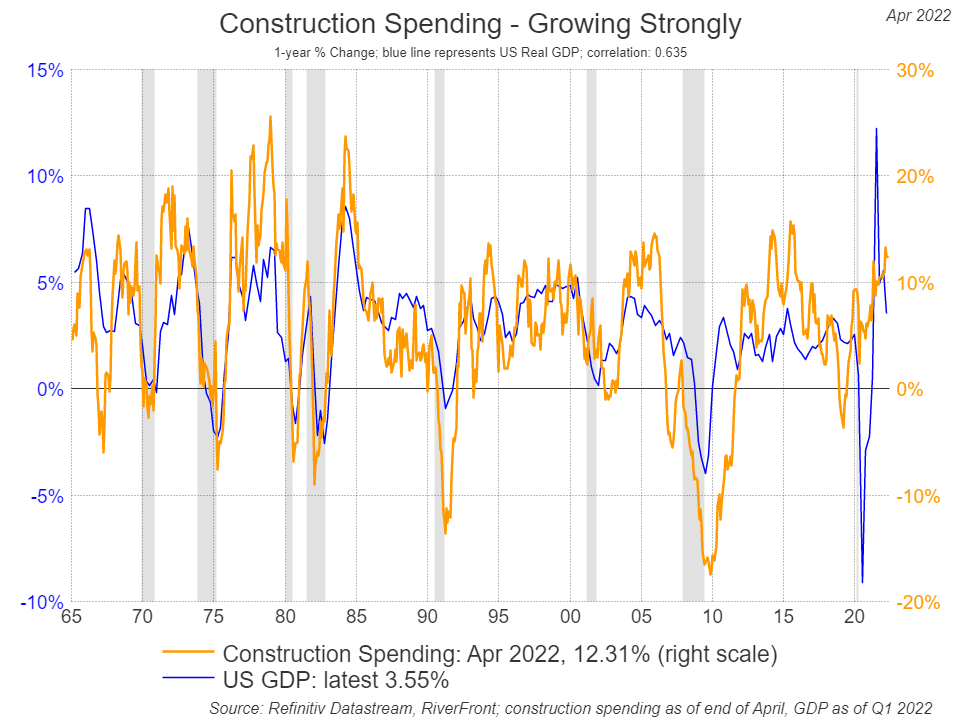
Source: Refinitiv Datastream, RiverFront. Construction data monthly as of April 2022. GDP data as of Q1 2022. Chart shown for illustrative purposes.
Construction Spending: Construction plays an important role as a job creator across many industries and as a driver of demand for both natural resources and finished goods. Currently, construction spending is growing at around 12%, a positive in our opinion, for future GDP growth.
Heavy Truck Sales[1]: Another related data point is yearly heavy truck sales which are running at 37k units/month – at the high end of its historical range – suggesting a strong economy, in our view. (see chart, right)
Lending: Positive – Access to Capital Remains Robust
Capital represents ‘lifeblood’ for most businesses. Without access to capital, companies are unable to grow and may even need to restrict existing operations.
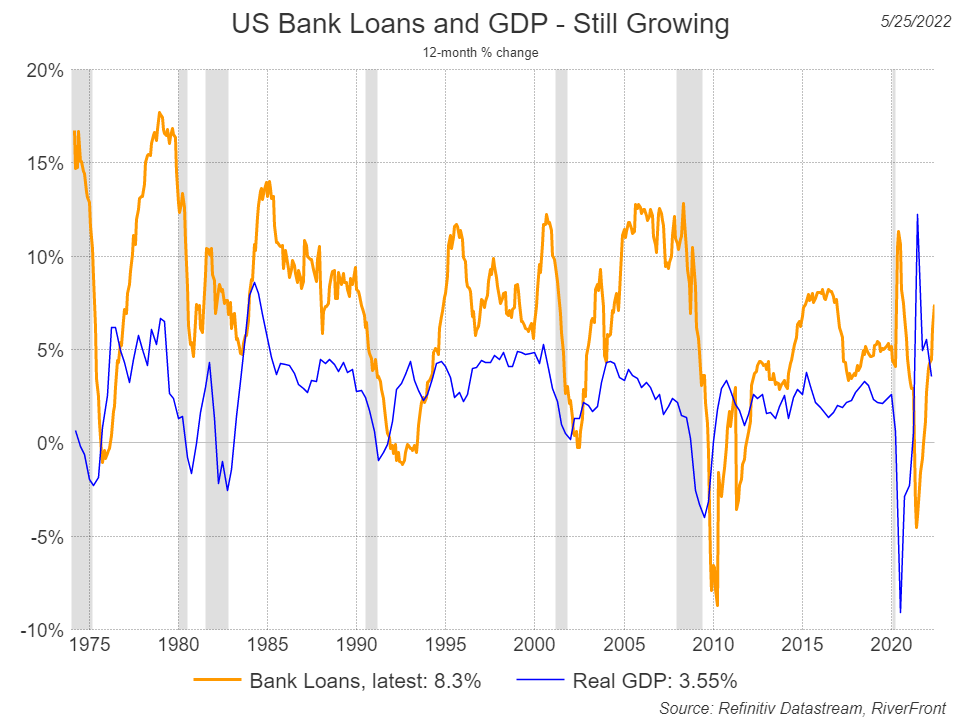
Source: Refinitiv Datastream, RiverFront. Bank Loan data monthly as of May 2022. GDP data as of Q1 2022. Chart shown for illustrative purposes.
Bank loan creation grew at a historically strong year-over-year rate in May of this year (see chart, left), suggesting to us that companies still are both willing and able to access capital for growth initiatives, hiring, and recapitalization.
Leading Economic Indicators (LEI): Neutral – Well Above Zero, Decelerating
The Conference Board’s ‘Leading Economic Indicators’ (LEI) is a predictive variable that is designed to anticipate turning points in the business cycle by roughly seven months.
The LEI is comprised of 10 indicators related to employment, business orders, residential housing demand, stock market prices, and bond market credit conditions.
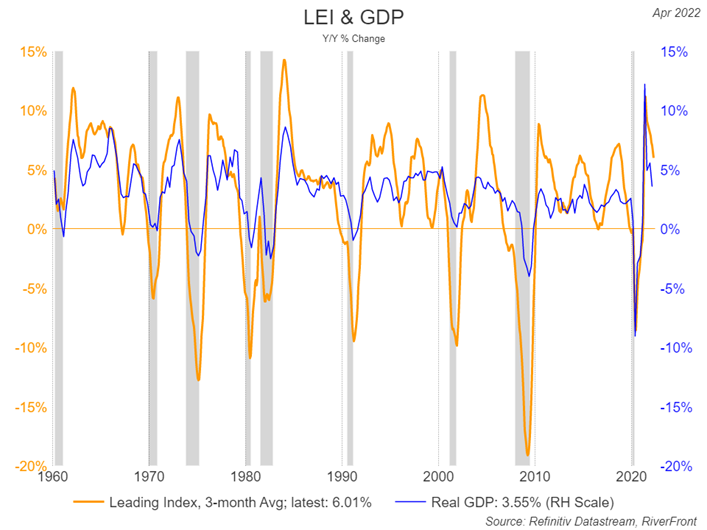
Source: Refinitiv Datastream, RiverFront. LEI data monthly as of April 2022. GDP data as of Q1 2022. Chart shown for illustrative purposes.
The change in LEI is still well above zero (see chart, right), suggesting to us, positive GDP growth in the future. The LEI has declined back to levels we associate with a healthy economic backdrop.
LEI From a Historical Perspective: Current Expansion Appears to Have Plenty of Room to Run
In analyzing LEI behavior during economic expansions over the last 60 years, we think it is worth pointing out that the current expansion (4/2020 to today – thick blue line, chart below) appears early in its lifecycle relative to most others.
As measured by the LEI reading, the current expansion has also been the strongest through its first two years coming out of recession.
This suggests to us that the current economic expansion is likely to continue for the foreseeable future, but its pace may need to cool further, creating uncertainty.

Source: Refinitiv Datastream, RiverFront, chart shown for illustrative purposes.
Conclusion
A strong economy, such as we have had, usually causes the Federal Reserve to raise rates. This tends to make investors nervous as to whether rising rates will end the expansion. If, as we expect, economic growth slows, but remains positive we think the bull market in stocks can resume. However, it may take many more months for the fear of recession to die down.
[1] The Sahm Rule With The Eponymous Economist: The Indicator from Planet Money: NPR
[2] Heavy trucks weigh over 26,000 pounds and include 18-wheeler tractors, cement mixers, and city buses.
Important Disclosure Information:
The comments above refer generally to financial markets and not RiverFront portfolios or any related performance. Opinions expressed are current as of the date shown and are subject to change. Past performance is not indicative of future results and diversification does not ensure a profit or protect against loss. All investments carry some level of risk, including loss of principal. An investment cannot be made directly in an index.
Chartered Financial Analyst is a professional designation given by the CFA Institute (formerly AIMR) that measures the competence and integrity of financial analysts. Candidates are required to pass three levels of exams covering areas such as accounting, economics, ethics, money management and security analysis. Four years of investment/financial career experience are required before one can become a CFA charterholder. Enrollees in the program must hold a bachelor’s degree.
All charts shown for illustrative purposes only. Information or data shown or used in this material was received from sources believed to be reliable, but accuracy is not guaranteed.
This report does not provide recipients with information or advice that is sufficient on which to base an investment decision. This report does not take into account the specific investment objectives, financial situation or need of any particular client and may not be suitable for all types of investors. Recipients should consider the contents of this report as a single factor in making an investment decision. Additional fundamental and other analyses would be required to make an investment decision about any individual security identified in this report.
Gross domestic product (GDP) is the total monetary or market value of all the finished goods and services produced within a country’s borders in a specific time period. As a broad measure of overall domestic production, it functions as a comprehensive scorecard of a given country’s economic health
The Conference Board (CB) is a not-for-profit research organization that distributes vital economic information to its peer-to-peer business members. The Composite Index of Leading Indicators, otherwise known as the Leading Economic Index (LEI), is an index published monthly by The Conference Board
In a rising interest rate environment, the value of fixed-income securities generally declines.
Stocks represent partial ownership of a corporation. If the corporation does well, its value increases, and investors share in the appreciation. However, if it goes bankrupt, or performs poorly, investors can lose their entire initial investment (i.e., the stock price can go to zero).
Bonds represent a loan made by an investor to a corporation or government. As such, the investor gets a guaranteed interest rate for a specific period of time and expects to get their original investment back at the end of that time period, along with the interest earned. Investment risk is repayment of the principal (amount invested). In the event of a bankruptcy or other corporate disruption, bonds are senior to stocks. Investors should be aware of these differences prior to investing.
RiverFront Investment Group, LLC (“RiverFront”), is a registered investment adviser with the Securities and Exchange Commission. Registration as an investment adviser does not imply any level of skill or expertise. Any discussion of specific securities is provided for informational purposes only and should not be deemed as investment advice or a recommendation to buy or sell any individual security mentioned. RiverFront is affiliated with Robert W. Baird & Co. Incorporated (“Baird”), member FINRA/SIPC, from its minority ownership interest in RiverFront. RiverFront is owned primarily by its employees through RiverFront Investment Holding Group, LLC, the holding company for RiverFront. Baird Financial Corporation (BFC) is a minority owner of RiverFront Investment Holding Group, LLC and therefore an indirect owner of RiverFront. BFC is the parent company of Robert W. Baird & Co. Incorporated, a registered broker/dealer and investment adviser.
To review other risks and more information about RiverFront, please visit the website at www.riverfrontig.com and the Form ADV, Part 2A. Copyright ©2022 RiverFront Investment Group. All Rights Reserved. ID 2232233
