The wild price swings in U.S. equities over the past few weeks have a lot of investors wondering if this kind of volatility is normal, and whether it means we’re on the brink of a new bear market. Staking claim on a new bear market can be tricky since the official definition usually requires a price decline of at least 20%. Waiting for confirmation before acting can be hazardous to your client relationships, and to their wealth.
The good news is bear markets present unique characteristics that emerge in their beginning stages usually well before prices reach a 20% decline. They are leading indications the tide may be shifting from a bullish environment for equities to bearish and are worth watching. Since measuring and adjusting to market volatility and trends is a key ingredient in our risk-management process, we have observed several key indications of bear markets over the years.
A distinct change in daily volatility is one of the initial key indicators of an emerging bear market.
It seems like ancient history now, but it was just two weeks ago that investors cheered a +4.8% gain for the week in the S&P 500. It was the best weekly return since August 26, 2011 and had the bulls hopeful for a year-end Santa Claus rally. Those cheers fell silent the following week when the S&P fell -4.6%, its worst weekly loss since—wait for it—August 19, 2011. This kind of market schizophrenia almost always results in financial commentators claiming something is different this time, and they often place blame on mysterious market villains like “High Frequency Trading” and the “Algos”.
No, it’s not different this time.
Fact is, the recent back-to-back weekly gains and declines aren’t unusual. We have a term for the phenomenon in which large rallies and large losses occur within days of each other just like they did in 2011. We call it Volatility Clustering, and it’s a defining characteristic of Bear Markets, driven by growing investor angst and indecision.
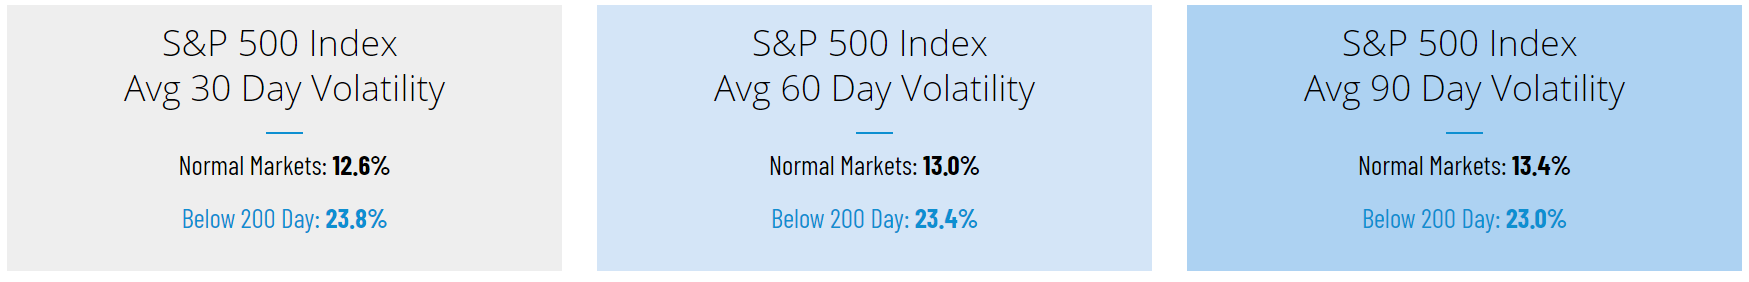
We see indications that investors should be prepared for higher volatility going forward. Why? The S&P 500 recently crossed below its 200-day moving average, a widely used indicator of bull and bear trends. And for good reason: As the table below shows, rolling 30, 60 and 90-day volatility literally doubles when the S&P 500 Index falls below that threshold.
S&P 500 Index Standard Deviation (Volatility):
January 3, 1990 – December 12, 2018