
By Rod Smyth, Chairman of the Board of Directors
SUMMARY
- The economy is experiencing a strong recovery with unusually high wage and inflation growth, in our view.
- We believe this makes the Fed’s job difficult and creates market uncertainty.
- For RiverFront, this underlines the importance of being agile.
Be Careful What You Wish For. History Shows More Gradual Recoveries Have Been Good for Markets.
In the December 6th Weekly View: Putting Things in Perspective, we discussed the remarkable recovery from the pandemic lows of both the economy and corporate earnings. This week we look at this ‘V-shaped’ profile of the current recovery and think about its implications. This recession was like no other and so it makes sense that the recovery is also unlike its predecessors. However, the remarkable pace of the recovery in gross domestic product (GDP) and the acceleration of inflation to a 30-year high makes the job of policymakers much more difficult in this early stage of a new economic cycle.
Although Main Street can get frustrated when a recovery is gradual, at Riverfront we have written many times about the typical advantages of a gradual recovery to financial markets.
- Inflation remains lower for longer
- Fed policy can remain supportive for longer
- Investor sentiment typically avoids excessive optimism
- Lack of excesses can prolong the economic and stock market cycle
Slow Recoveries Have Been Prolonged Recoveries
I remember the 1992, 2003 and 2010 recoveries well. Many, including sitting President George H.W. Bush were frustrated by how slow those recoveries were. The economy was beginning to recover in the 1992 election year, but voters didn’t feel it and he lost to the outsider Bill Clinton who capitalized on this frustration through one of his campaign slogans: “It’s the economy stupid”. It is purported that Bush always blamed, then Fed Chair Alan Greenspan, for not cutting interest rates quickly enough.
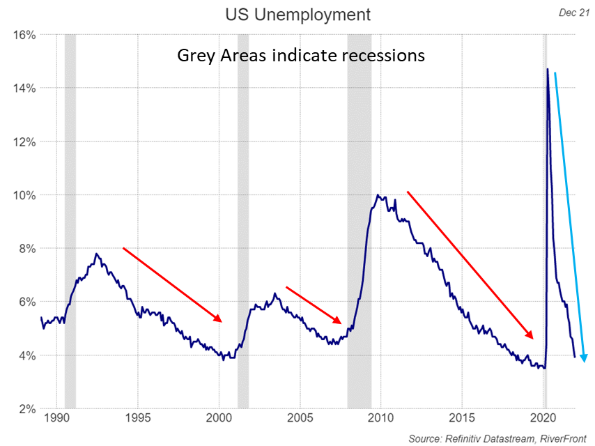
As you can see in Chart 1 below, although the end of the recession was determined to have been in 1991, unemployment continued to rise before gradually falling over the next decade. Since it took time for the unemployment rate to start falling, the 1992 and subsequent 2003 and 2010 recoveries were often referred to as ‘jobless’ recoveries (see red arrows on chart 1). The economic expansion that began in 1992 lasted throughout the decade as did the expansion that began in 2010. During this time, we witnessed the long bull markets of the 1990s and 2010s.
Chart 1: Rapid Rise, Remarkable Decline
Source: Refinitiv Datastream, RiverFront. Chart shown for illustrative purposes only.
This Cycle Is Different – A ‘V’ Shaped Recovery is Unfolding
The pandemic caused many parts of the economy to shut down and therefore the unemployment rate to skyrocket. Once the economy started to reopen, the unemployment level quickly dropped from over 14% to just 4% as of December 2021. The remarkable thing is not that it fell, but rather that it returned to almost pre-pandemic levels in just the last year (see blue arrow).
Another difference about this recovery has been the spike in inflation, only in part due to supply chain issues. Inflation is usually tame coming out of a recession as the fall in demand from the recession has put pressure on prices. This time is very different (see chart below). The challenge for the Fed is to determine which inflationary pressures are temporary and which more enduring. This will make their decisions about how much, and when to raise interest rates very difficult in our view, especially as their policies are designed to influence demand and they have no control over supply-chain issues. It will also mean that investors will have to deal with policymakers’ uncertainty, and financial markets typically don’t like uncertainty, hence the volatility we are expecting.
Coincident with the sharp fall in unemployment has been upward pressure on wages, at the fastest pace for a decade coinciding with a tight labor market – you have probably seen the ‘help wanted’ signs for months in your communities.
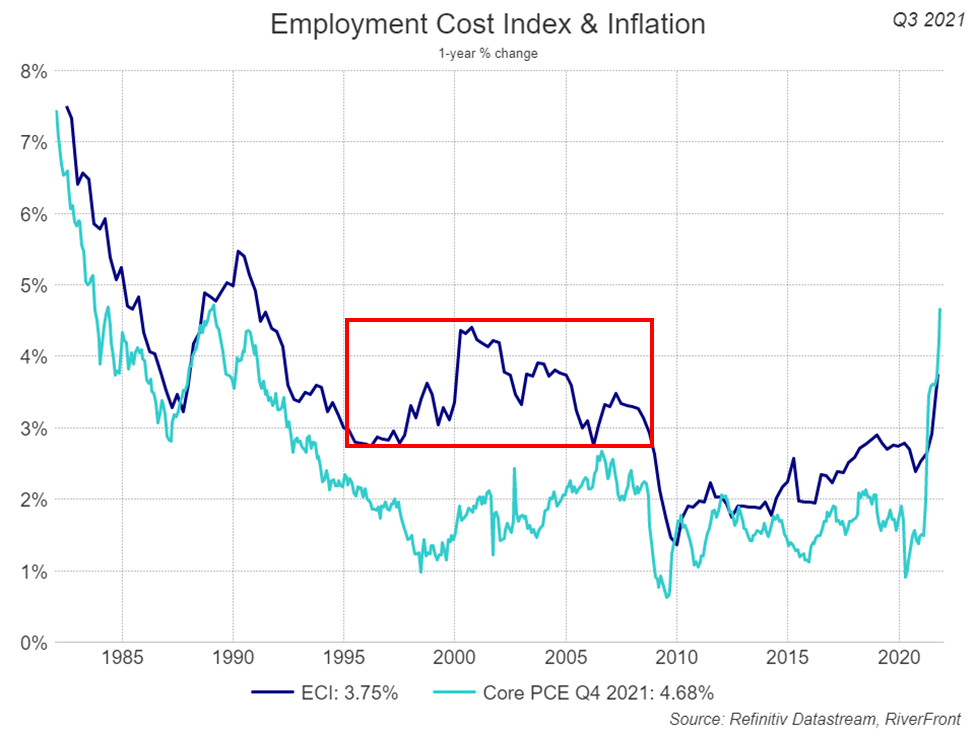
Chart 2. Rapid Acceleration in Wages and ‘Core’ Inflation
Source: Refinitiv Datastream, RiverFront. Chart shown for illustrative purposes only. See disclosures for definitions.
In the chart (left), the darker line is the employment cost index (ECI), a good representation of wage growth in our view. As the chart shows, this index tends to run a bit ahead of inflation. The rise in inflation ex food and energy, represented by the Fed’s preferred measure – core personal consumption expenditures (PCE) – has been so rapid that employment costs have not caught up yet. Given the base case inflation forecast in our 2022 Outlook of around 3.5% consumer price index (CPI), it is likely that employment costs will be stay in a similar range to the 1995 to 2007 period (red rectangle). Stronger wage growth should fuel the recovery with stronger demand for goods and services and thus revenues and profits.
Be Careful What You Wish For
Just as the gradual recoveries put little upward pressure on inflation (the PCE was less that 2% for most of the 1995 to 2020 period), this recovery is leading to higher inflation pressures. While wages will rise, they may not rise much more than inflation and we think the stock market’s future will be greatly affected by the Fed’s actions in response to this data. As we wrote last week, there are risks that they don’t do enough and inflation gets somewhat out of hand – the pessimistic scenario in our outlook calls for 5% inflation leading to more Fed tightening which would hurt stocks, in our view. There is also the risk that they do too much and the recovery stalls, also not good for stocks. However, as the table below from our 2022 Outlook shows, we only give the pessimistic case a 25% probability.

The table above depicts RiverFront’s predictions for 2022 using three scenarios (Pessimistic (Bear), Base, and Optimistic (Bull)). Our assessment of each scenario’s probability (“RiverFront Investment Group Probability”) is also shown. The assessment is based on RiverFront’s Investment team’s views and opinions as of 12.06.2021. Each case is hypothetical and is not based on actual investor experience. These views are subject to change and are not intended as investment recommendations. There is no representation that an investor will or is likely to achieve positive returns, avoid losses or experience returns as discussed for various market classes. H2 = Second half of calendar year. Stagflation is the persistent high inflation combined with high unemployment and stagnant demand in a country’s economy. See Definitions & Disclosures section for index definitions.
Conclusion:
A V-shaped economic recovery is creating a more volatile stock market where every action by policymakers is highly scrutinized. For our portfolios, this means that we recognize the importance of being agile and being alert to conditions which challenge our highest probability outcome, our base case. As you can see in the table above, in our base case CPI inflation falls to around 3.5%, growth stays strong at around 4% and long-term interest rates rise, but not enough to hurt stocks which have a positive year.
Important Disclosure Information
The comments above refer generally to financial markets and not RiverFront portfolios or any related performance. Opinions expressed are current as of the date shown and are subject to change. Past performance is not indicative of future results and diversification does not ensure a profit or protect against loss. All investments carry some level of risk, including loss of principal. An investment cannot be made directly in an index.
Chartered Financial Analyst is a professional designation given by the CFA Institute (formerly AIMR) that measures the competence and integrity of financial analysts. Candidates are required to pass three levels of exams covering areas such as accounting, economics, ethics, money management and security analysis. Four years of investment/financial career experience are required before one can become a CFA charterholder. Enrollees in the program must hold a bachelor’s degree.
Information or data shown or used in this material was received from sources believed to be reliable, but accuracy is not guaranteed.
This report does not provide recipients with information or advice that is sufficient on which to base an investment decision. This report does not take into account the specific investment objectives, financial situation or need of any particular client and may not be suitable for all types of investors. Recipients should consider the contents of this report as a single factor in making an investment decision. Additional fundamental and other analyses would be required to make an investment decision about any individual security identified in this report.
Gross domestic product (GDP) is the total monetary or market value of all the finished goods and services produced within a country’s borders in a specific time period. As a broad measure of overall domestic production, it functions as a comprehensive scorecard of a given country’s economic health.
Personal Consumption Expenditures (PCEs) refers to a measure of imputed household expenditures defined for a period of time.
Stocks represent partial ownership of a corporation. If the corporation does well, its value increases, and investors share in the appreciation. However, if it goes bankrupt, or performs poorly, investors can lose their entire initial investment (i.e., the stock price can go to zero). Bonds represent a loan made by an investor to a corporation or government. As such, the investor gets a guaranteed interest rate for a specific period of time and expects to get their original investment back at the end of that time period, along with the interest earned. Investment risk is repayment of the principal (amount invested). In the event of a bankruptcy or other corporate disruption, bonds are senior to stocks. Investors should be aware of these differences prior to investing.
Technical analysis is based on the study of historical price movements and past trend patterns. There are no assurances that movements or trends can or will be duplicated in the future.
In a rising interest rate environment, the value of fixed-income securities generally declines.
Index Definitions:
Standard & Poor’s (S&P) 500 Index measures the performance of 500 large cap stocks, which together represent about 80% of the total US equities market.
The Consumer Price Index (CPI) is a measure that examines the weighted average of prices of a basket of consumer goods and services, such as transportation, food, and medical care. It is calculated by taking price changes for each item in the predetermined basket of goods and averaging them. Changes in the CPI are used to assess price changes associated with the cost of living. The CPI is one of the most frequently used statistics for identifying periods of inflation or deflation.
The Employment Cost Index (ECI) is a quarterly economic series published by the Bureau of Labor Statistics that details the growth of total employee compensation. The index is prepared and published by the Bureau of Labor Statistics (BLS), a unit of the United States Department of Labor. It tracks movement in the cost of labor, as measured by wages and benefits, at all levels of a company.
RiverFront Investment Group, LLC (“RiverFront”), is a registered investment adviser with the Securities and Exchange Commission. Registration as an investment adviser does not imply any level of skill or expertise. Any discussion of specific securities is provided for informational purposes only and should not be deemed as investment advice or a recommendation to buy or sell any individual security mentioned. RiverFront is affiliated with Robert W. Baird & Co. Incorporated (“Baird”), member FINRA/SIPC, from its minority ownership interest in RiverFront. RiverFront is owned primarily by its employees through RiverFront Investment Holding Group, LLC, the holding company for RiverFront. Baird Financial Corporation (BFC) is a minority owner of RiverFront Investment Holding Group, LLC and therefore an indirect owner of RiverFront. BFC is the parent company of Robert W. Baird & Co. Incorporated, a registered broker/dealer and investment adviser.
To review other risks and more information about RiverFront, please visit the website at www.riverfrontig.com and the Form ADV, Part 2A. Copyright ©2022 RiverFront Investment Group. All Rights Reserved. ID 1994460
