
Recent broad based equity market gains have been driven by a limited number of companies, and many investors theorize that the recent outperformance of these names will continue. Market history suggests that valuations eventually matter as the market laggers become the leaders. Reversion to the mean is an extraordinarily strong force in the markets as are the behavioral mistakes, such as recency bias, that can lead to investors allocating money into very rich valuations.
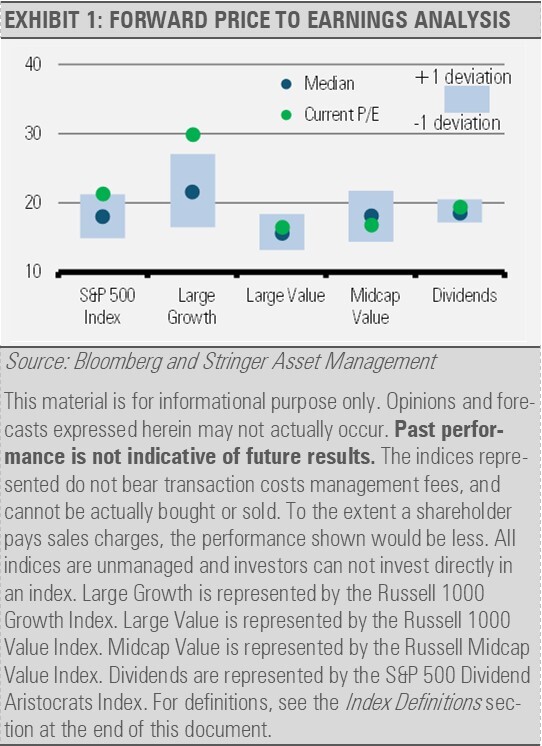
At the end of July 2023, the Russell 1000 Growth Index was trading at a forward price-to-earnings (PE) multiple of 29x, which is 25% above its average forward PE during the prior ten years. Over the preceding three months, the Index’s price appreciated 15% while consensus earnings estimates declined almost 2% according to Bloomberg. The net effect of these changes has created an Index with expensive current valuations and diminishing future prospects.
We have seen these kinds of performance chasing and speculative environments before, and while the timing of these previous runs may differ, the result has always been the same. History and experience teach us that paying up to invest in areas that have already had a strong run, especially those that are trading at speculative levels, can be hurtful to financial goals.
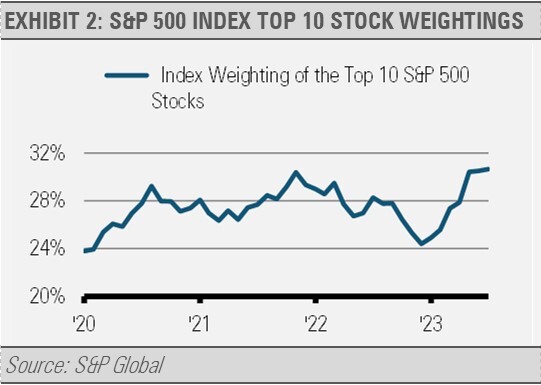
A similar measure of the narrowness of the recent market gains can be seen in the weighting of the top ten stocks in the S&P 500 Index, which does increase to extreme levels from time to time. The most recent measure has remained elevated for longer than usual, but that doesn’t suggest their relative weightings (e.g., market capitalizations relative to the other constituents) will not decline in the coming months. To believe otherwise would be betting against history rather than learning from it.
We do not think that the recent stock market winners necessarily need to see a price crash, though the companies with more stretched valuations are at an increased risk. History shows repeatedly that these types of market trends do not last.
Unfortunately, human beings are hardwired to make behavioral errors that can compound these issues. Two of the most important behavioral errors that investors often make are recency bias and herd behavior.
Recency bias is the tendency to give more weight to recent events or experiences when making decisions. Investors affected by recency bias may overweight current market trends or short-term performance and downplay historical data or longer-term relationships.
Herd behavior, or chasing trends, is another impactful tendency. As social beings, we are predisposed to seek the comfort of company. If we see continued market actions in one direction or another, we tend to seek the comforts of joining the market herd. This market activity can eventually push stock prices significantly away from fair value. All trends must eventually come to an end as divergences from fair value cannot last forever. Markets will eventually identify these differences between price and value and correct them accordingly.
It is the deviation from fair value that concerns us most today. With the Russell 1000 Growth Index trading at a 25% premium to its 10-year average, today’s valuations look stretched. The situation may be even more extreme than the premium suggests given that interest rates were significantly lower over the previous ten years than they are today. As a result, borrowing costs are much higher than they have been, which could pinch future earnings. In addition, the discount factor to arrive at the present value of future earnings is also greater today than even a year ago. Therefore, we think that stock prices exhibiting these types of valuations are far more likely to see increased headwinds going forward.
Conversely, and as a result of this narrow market rally, we are finding a bounty of opportunities in areas that have lagged. Rather than betting against history, we have been increasingly allocating to the value style as well as dividend payers that have lagged this year’s market rally. All it takes is a little bit of patience and fortitude to reap what history suggests could be excellent investment opportunities going forward.
DISCLOSURES
Any forecasts, figures, opinions or investment techniques and strategies explained are Stringer Asset Management, LLC’s as of the date of publication. They are considered to be accurate at the time of writing, but no warranty of accuracy is given and no liability in respect to error or omission is accepted. They are subject to change without reference or notification. The views contained herein are not to be taken as advice or a recommendation to buy or sell any investment and the material should not be relied upon as containing sufficient information to support an investment decision. It should be noted that the value of investments and the income from them may fluctuate in accordance with market conditions and taxation agreements and investors may not get back the full amount invested.
Past performance and yield may not be a reliable guide to future performance. Current performance may be higher or lower than the performance quoted.
The securities identified and described may not represent all of the securities purchased, sold or recommended for client accounts. The reader should not assume that an investment in the securities identified was or will be profitable.
Data is provided by various sources and prepared by Stringer Asset Management, LLC and has not been verified or audited by an independent accountant.
Index Definitions:
S&P 500 Index – This Index is a capitalization-weighted index of 500 stocks. The Index is designed to measure performance of a broad domestic economy through changes in the aggregate market value of 500 stocks representing all major industries.
Russell 1000 Growth Index – This Index measures the performance of the large cap growth segment of the U.S. equity universe. It includes those Russell 1000 companies with relatively higher price-to-book ratios, higher I/B/E/S forecast medium term growth and higher sales per share historical growth. The Index is constructed to provide a comprehensive and unbiased barometer for the large-cap growth segment. The Index is completely reconstituted annually to ensure new and growing equities are included and that the represented companies continue to reflect growth characteristics.
Russell 1000 Value Index – This Index measures the performance of the large cap value segment of the U.S. equity universe. It includes those Russell 1000 companies with relatively lower price-to-book ratios, lower I/B/E/S forecast medium term growth and lower sales per share historical growth. The Index is constructed to provide a comprehensive and unbiased barometer for the large-cap value segment. The Index is completely reconstituted annually to ensure new and growing equities are included and that the represented companies continue to reflect value characteristics.
Russell Midcap Value Index – This Index measures the performance of the midcap value segment of the U.S. equity universe. It includes those Russell Midcap Index companies with relatively lower price-to-book ratios, lower I/B/E/S forecast medium term growth and lower sales per share historical growth. The Index is constructed to provide a comprehensive and unbiased barometer of the mid-cap value market. The Index is completely reconstituted annually to ensure larger stocks do not distort the performance and characteristics of the true midcap value market.
S&P 500 Dividend Aristocrats Index – This Index tracks companies within the S&P 500 Index that have a record of raising their dividends for at least 25 consecutive years. Each company is equally weighted within the Index. S&P will remove companies from the Index when they fail to increase dividend payments from the previous year. The Index’s universe includes stocks with a float-adjusted market capitalization of at least $3 billion and an average daily trading volume of at least $5 million, in addition to consistently increasing dividend payments. The index requires a minimum of 40 companies.
For more news, information, and analysis, visit the ETF Strategist Channel.
