

The Investor Sentiment Survey, which is produced by the American Association of Individual Investors (AAII), is a weekly survey that asks individuals whether they have a bullish, neutral, or bearish perspective on the markets right now. The survey results illustrate investor optimism (or pessimism) regarding where they think the markets will be in six months.
Latest Survey Results
For the first time since April 2021, sentiment survey results showed that more than 50% of investors surveyed were bullish on the markets. Additionally, only 21.5% held a bearish point of view, the lowest since June 2021. Given these results, it appears investors have worked off the extreme recession fears that we heard about last year. There is nothing that will raise market optimism quite like higher prices.
What do the latest Sentiment Survey results tell us?
The sentiment survey is often viewed as a contrarian indicator. As stated directly on the AAII’s website, “If you’re looking at the AAII Investor Sentiment Survey for guidance on the possible future direction of the market, it’s important to understand that it is deemed a contrarian indicator… A contrarian indicator tells investors that it may be a good time to go in the opposite direction of the herd.”
As an example of the contrarian nature of this indicator, just prior to the S&P 500’s peak in November 2021, bullish sentiment hit a high at 48%, while bearish sentiment registered at 24%. Then, nearly a year later, as the market neared its low in September 2022, bullish sentiment was also at its low of 17%, while bearish sentiment was above 60%. Now as the market has rebounded, bullish sentiment is yet again at a high, while bearish sentiment is now at a low.
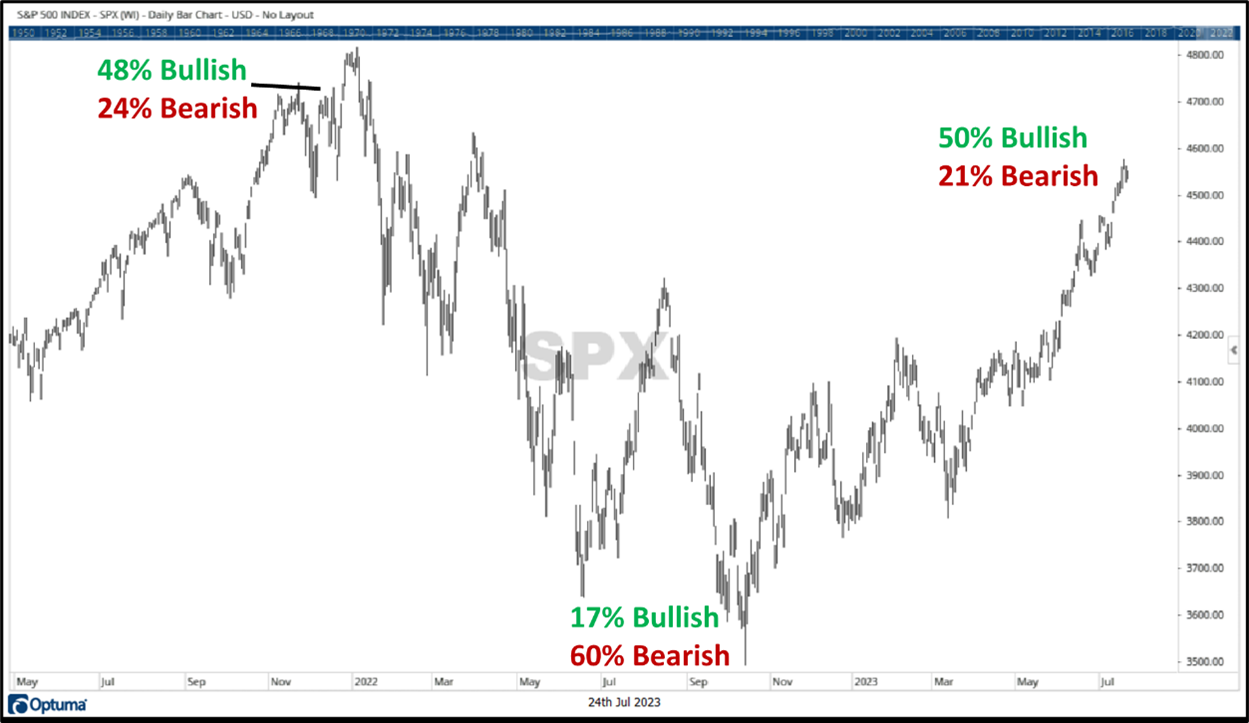
Source: Chart created by Canterbury Investment Management using Optuma Technical Analysis Software. Investor Sentiment data provided by AAII Sentiment Survey
Markets are counterintuitive. In many cases, they will do the opposite of what the masses expect them to do. Investor pessimism reached a high back in October as the S&P 500 reached a low point, before heading up. Now, as markets have improved, investors have become increasingly optimistic.
High levels of optimism can remain for extended periods of time, but at some point, will revert to the average. As evidence shows, this would mean that the market would decline to lower investor optimism.
Market Trends
We have discussed how the market has been fueled by a sharp rise in a few larger technology-related stocks. Now, over the last month or two, other market sectors have started to play a little catch-up. Overall, that is a positive for the markets. It should be noted, however, that many technology stocks do appear to be extended. Last week, a few of the market’s larger components, the same stocks that have seen significant rises this year, looked a little shaky. If “shakiness” in technology stocks becomes a trend, it could have a negative impact on the markets due to the lopsided weightings in the markets.
Here are a Few Things to Watch For
As mentioned above, some stocks looked a bit shaky last week. Here are some securities to keep an eye on that could impact the market’s fluctuations. These are just a few minor technical observations. Note that some observations reference “Fibonacci” retracements. Fibonacci retracement levels stem from Fibonacci sequences and are horizontal lines that indicate where support/resistance are likely to occur.
- (1) META- Meta stock (Facebook) is the 7th largest stock in the S&P 500. It has been one of the year’s best performers and has more than tripled in price since its November low (it should also be noted that it is still more than 25% off its 2021 high point, even after the significant rise). Over Thursday and Friday, META declined by -6.87% and had a negative impact on the market. The stock has declined to an area of potential support and will be interesting to see if it can “hold the line.”
- (2) AMZN- Amazon, the third largest S&P 500 stock appears to be hovering around technical area of resistance in the $130-135 price range. This area of resistance comes at a 50% retracement level of the stock’s overall decline and could potentially prove difficult to break through.
- (3) TSLA- Tesla is usually a very volatile stock. After a parabolic rally, the stock managed to retrace 61.8% (a Fibonacci retracement) of its overall decline, before falling by -11% to end last week. Tesla is the 6th largest S&P 500 stock.
- (4) Financials- After a disastrous decline in March, the financial sector (3rd largest market sector) has done some recovery work in the last few weeks, but is quickly approaching an area of resistance, that also intersects a 50% retracement of its total decline.
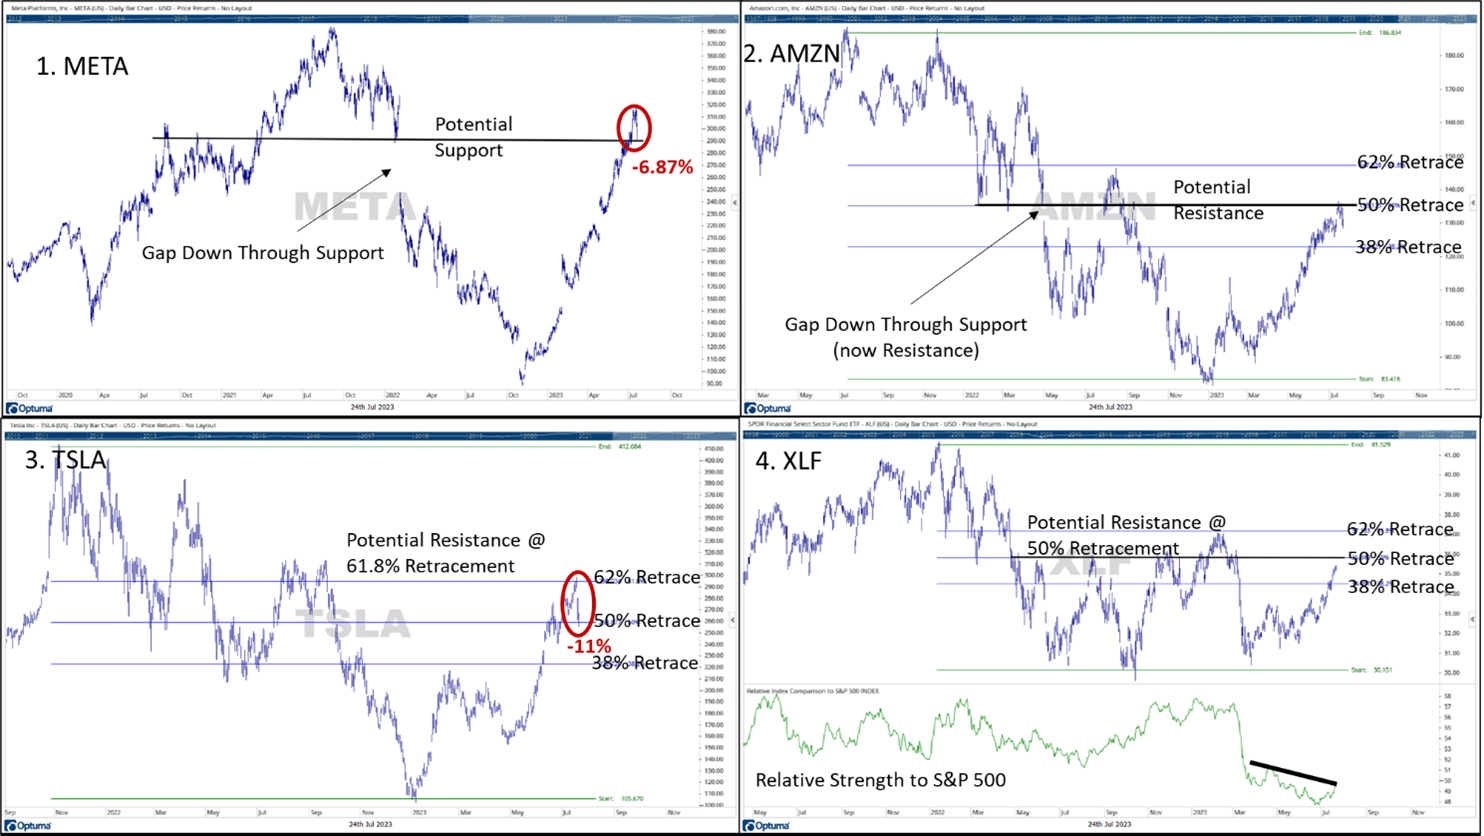
Source: Observations made by Canterbury Investment Management. Charts created using Optuma Technical Analysis Software.
Bottom Line
A sentiment survey of individual investors showed that many more people are starting to become optimistic about the market. While those optimistic characteristics may stay in place for some time, sentiment is a contrarian indicator, and high bullish sentiment would increase the likelihood of a pullback or decline.
As an observation, much of the increase in bullish sentiment appears to coincide with the brighter outlook (or less negative outlook) on the economy that is being reported. Regardless of the survey, I think there are still a fair number of investors out there who are hesitant to believe that the markets and economy could get much better from here. Remember that it is impossible to predict the markets. Just a few short months ago, many economists thought the markets would head lower because the economy was doomed for a recession. Now those fears have shrunk.
Reading the tea leaves on the markets can be difficult, particularly in an environment like right now. A few larger technology stocks have seen parabolic increases in a very short amount of time. That has caused the markets to rise higher. Now, we are beginning to see some other sectors attempt to play catch up, while those technology stocks enter into areas of potential concern.
The S&P 500 has not seen an “outlier” day (trading day beyond +/-1.50%) in the last 52 trading days. On average, the market will experience an outlier day every 20 trading days during a normal, efficient market environment. This is the largest number of consecutive days without an outlier seen since just before the start of the 2020 pandemic. In other words, the markets may be “due” for an outlier day, in either direction. This outlier could likely be fueled by the upcoming earnings season, particularly for technology stocks.
For more news, information, and analysis, visit the ETF Strategist Channel.