

RBA’s portfolios are sometimes included in alternative asset allocations because of our “go anywhere” macro strategy. However, we differ greatly from traditional alternative managers in that our fees are typically much lower and investors’ liquidity is on demand.
The potential for a multi-year or secular increase in market volatility has increasingly influenced our portfolio positioning. However, most asset allocators don’t realize how an extended period of financial market volatility could affect the performance of alternative assets. The environment seems to be changing, and investors need to invest like a chameleon and change their colors.
Decreasing liquidity could propel secularly higher volatility
The primary factor influencing financial market volatility is liquidity. Many investors seek to buy when a market dips, but few ever ask why investors generally don’t buy when there is a significant bear market. Of course, there are psychological factors that can impede disciplined investment processes, but that explanation overlooks that investors often simply can’t buy at the market low because they don’t have the liquidity to do so.
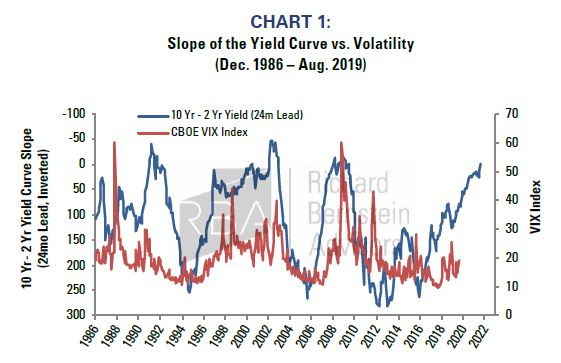
Chart 1 shows the relationship between the effects of Federal Reserve policy (depicted here as the slope of the yield curve) and equity market volatility. Although not a perfect relationship, there has historically been a strong link between liquidity and equity market implied volatility. The effects of monetary policy on financial market volatility can have significant lags because the Fed can’t force financial institutions to start or to stop lending.
We were very bullish 9 years ago partly because of the relationship between monetary policy and financial market volatility. Central banks around the world were desperately trying to add liquidity to the financial system in response to the global financial crisis, and we posited that US equity market volatility would be lower than was expected for a very long time because of the historically unprecedented liquidity injection.
That same relationship though is now causing us to re-evaluate our views on volatility. The gradual tightening of monetary policy has yet to work through the financial sector, but the inverted yield curve is suggesting that volatility could be on the rise.
This is not simply a US event. Chart 2 shows the proportion of global yield curves that are flat and inverted (i.e., 10-year to 2-year spread less than or equal to 100 bp). The sharp rise in this indicator suggests that global liquidity has been drying up, which implies that global financial markets are likely to become more volatile.

Popularity breeds underperformance
Perhaps the most important axiom of investing is that return on investment is highest when capital is scarce. Simple supply and demand suggest that the supplier of scarce capital should get higher returns through time. The lone bank in a town of 1000 borrowers will likely get a very high return on investment.
At the opposite extreme of a scarcity of capital, there have been enormous flows over the past decade into asset classes such as private equity and venture capital. Empirical Research Partners has estimated that investment flows into private equity and venture capital are bigger than the flows into US equity funds that corresponded to the Technology Bubble in the late-1990s1.
Simple supply and demand imply the consensus expected returns for private equity and venture capital are much too high. Private equity and venture capital managers have been extending the time periods of their funds (i.e., from 5 years to 10 years or from 10 years to 15 years) recognizing the difficulty of investing when too much money chases too few ideas. Reminiscent of past bubbles, investors appear increasingly willing to pay managers’ fees on capital that isn’t being invested and might not be invested for years to come.
Some hedge funds might be a better choice than PE and VC (yes, that’s us writing)
We’ve been very critical of “absolute return” hedge funds. Their fees are very high, their benchmarks are often inappropriate, their correlations to equities are higher than advertised, and their lock-ups are strict. In exchange for onerous terms, investors’ absolute return hedge funds’ returns have been inferior to those of short-term treasuries (i.e., more volatile and underperforming. See Chart 3).

However, an extended period of elevated market volatility might present opportunities for a few categories of hedge funds. Table 1 shows the correlation of various hedge funds strategies’ returns with the VIX
Index when volatility is increasing. A positive correlation suggests that a category’s returns tend to be positive as volatility increases.
There are several conclusions from this table:
- Contrary to popular belief, traditional asset allocation can provide better hedges against equity market volatility than can most hedge fund categories. Both gold and bond returns have positive correlation to upward trending
- To hedge funds’ partial credit, most hedge fund categories provide more protection against equity market volatility than the stock market itself. Yet, this is hardly remarkable because we are measuring S&P 500® returns versus S&P 500® implied volatility.
- Although hedge funds in general do provide protection against volatility on a relative basis versus the S&P 500®, very few do so on an absolute basis. Only currency-related hedge funds have had positive correlation to equity
- Hedge funds tend not to provide a true hedge against equity market volatility despite their ability to short

RBA’s current positioning
Except for an occasional currency hedge, RBA does not take short positions in its currently available multi-asset portfolios. Positioning for a potential period of increased volatility, therefore, requires old-fashioned asset allocation. (See “Asset Allocation 2.0TM” http://www.rbadvisors.com/ images/pdfs/Asset_Allocation_2.0.pdf). We have been gradually increasing our fixed-income and gold allocations as the table above might suggest one should and have been lowering the beta to our equity benchmark
as well. Investors often forget that equity market sensitivity is a function of both the equity weight and the beta to the equity benchmark when assets other than equities are included (i.e., equity-sensitive asset classes such as credit).
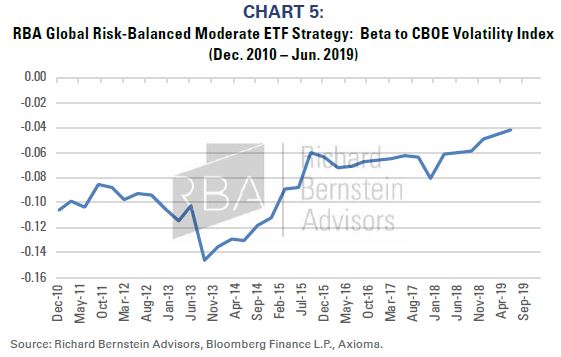
Charts 4 and 5 show our flagship portfolio’s equity beta and volatility beta. The portfolio’s sensitivity to the equity market across asset classes is currently the lowest in the past 9 years. The sensitivity to volatility is the highest its been because we have positioned the portfolio to benefit from increased volatility.

Invest like a chameleon
The investing environment might be changing, and we see an extended period of higher volatility than that which investors have grown accustomed. Accordingly, investment positioning should change as well. A period of rising volatility could hurt the returns of today’s most popular asset classes (private equity and venture capital), might benefit certain hedge fund categories, and could favor traditional asset classes like gold and high-quality bonds.
Richard Bernstein Advisors is a participant in the ETF Strategist Channel.