

By Chris Konstantinos, CFA, Director of Investments, Chief Investment Strategist
SUMMARY
- Inflation expectations have risen sharply over the last month, causing government bond yields to spike.
- Stocks have corrected but have demonstrated underlying resiliency, a positive sign, in our view.
- We remain cautiously optimistic on the stock market for 2023.
Despite Recent Pullback, Market Uptrend Still Intact
After a storming start to the year in January, both stocks and bonds pulled back in February. The culprit, in our opinion, has been the market’s recalibrated view of Federal Reserve (Fed) policy in the face of persistent inflation and economic growth signals. For instance, recent inflation data such as the Core Personal Consumption Expenditures (PCE) index, less food and energy, stopped falling in January, and increased more month-over-month than economists were expecting. The US economy also continues to outperform expectations. The Atlanta Fed’s GDPNow tracker estimates the US is trending towards 2.25% real GDP growth for Q1, and the employment market has continued its strength in February. Inflation expectations for the next year implied by derivative markets have increased markedly, from below 2% in mid-January, to over 3% today (see chart, below).
Inflation Expectations Rose Sharply in February
This strong inflation and growth impulse has sharply increased market expectations for interest rate hikes throughout the rest of ’23. Consider that, according to data inferred from fed funds futures markets[1], at the start of February the market was placing an approximately 80% probability of a year-end fed funds rate lower than 5.0%. However, by the end of the month, that probability had plummeted to under 10%. This major shift in rate views has had a direct negative effect on government bond pricing, with the 10-year treasury now back up close to 4%. This in turn has had an indirect effect on US stock valuations, where rate-sensitive growth sectors such as technology tend to dominate indexes like the S&P 500.
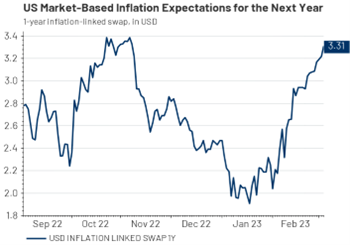
Source: Refinitiv Datastream, RiverFront. Data daily as of March 3, .2023.
Chart shown for illustrative purposes.
More hopefully, two leading indicators of inflation suggest inflation may ease. The National Federation of Independent Business’ (NFIB) ‘Propensity to Raise Wages’ survey has started to turn down and aggregate money supply growth (M2) is negative. These indicators have historically been positively correlated with inflation, and thus we think the recent moderation in both point to some hope for inflation to continue to ease.
Our View: Fed Likely to Remain ‘On the Case’ in Hiking Mode
We do not believe this Fed wants to repeat the mistakes of the late 1970s, whereby the Fed was forced to reverse course and hike interest rates multiple times to finally get inflation under control – a theme we discussed in our 2023 Outlook back in December.
Thus, given the disparity between the Fed’s 2023 forecasts for Core PCE of 3.5% versus its current 4.7% level and the continuing strength of the labor market, we believe the Fed still has more work to do. Throughout any rate hiking campaign of the past five decades, the Fed has never stopped hiking before the funds rate was above Consumer Price Index (CPI). Against this backdrop, we now believe that we could see at least another 100 bps of rate hikes on the horizon.
Stock Market Technical Update: Recent Uptrend Still Appears Intact
Equity markets have been surprisingly resilient in the face of this recalibration in the bond market. The last few weeks of weakness have certainly called into question the stock uptrend, but in our view market internals remain generally constructive.
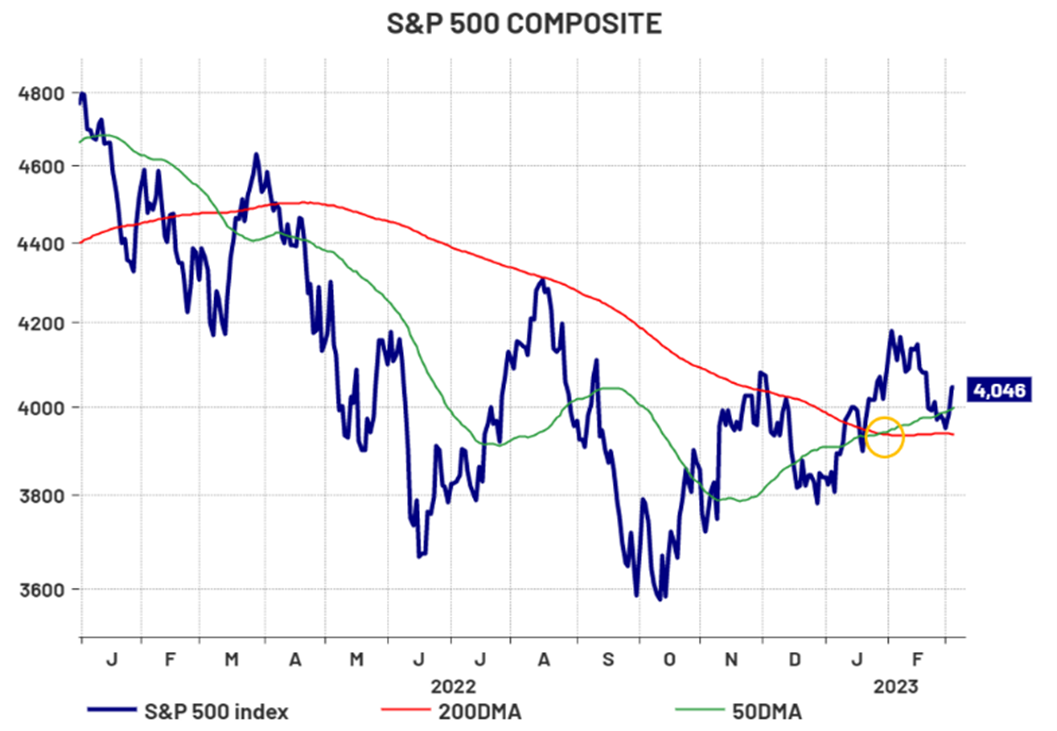
Source: Refinitiv Datastream, RiverFront. Data daily as of March 6, 2023.
Chart shown for illustrative purposes.
We feel that market bottoming is a process, not a single event. A number of bullish signals on the S&P 500 still suggest to us that the bottoming process is in its late stages, with the ultimate bear market low for this cycle likely made in October. We would especially note the flattening of the primary trend (200-day moving average–see red line on chart to the right), a breakout above that trend, and a recent ‘Golden Cross’ (when 50 day moving average – as represented by the green line – crosses above the 200-day; see orange circle on chart). The current level of the 200-day moving average is around 3940; we regard this and 3800 as the next important levels of support.
The stock pullback in February also makes sense to us in the context of extended crowd sentiment. A strong January drove near-term investor sentiment readings (as measured by sentiment polls such as Ned Davis Research’s (NDR) Daily Crowd Sentiment Poll and the American Association of Independent Investors – % Bullish – % Bearish index) up to levels associated with extreme optimism – a condition that often precedes a short-term market consolidation or pullback. It is worth noting that neither NDR’s Daily or Weekly Crowd Sentiment polls, nor the AAII poll, are currently in optimistic levels. This suggests to us that February’s market pullback has taken some of the froth out of trading sentiment– a contrarian positive, in our view.
Conclusion: Stock Market and Portfolio Implications
We share the market’s recent concern that the Fed is still in monetary tightening mode and that interest rate hikes are likely to continue for the foreseeable future. However, at RiverFront we also believe in the ‘message of markets’. Stocks and credit markets have remained resilient even as bond yields have spiked. We think it is a positive ‘message’ that these risk markets are willing to look through the recent inflationary impulse. We are sticking with our forecast made in our 2023 Outlook that stock markets are likely to have positive returns in 2023 but admit that the stock market is likely to remain volatile in the near-term.
Given the uncertainties and lower visibility into both the economy’s trajectory (see our Weekly View from 1/31/23 on our views of recession risk) and Federal Reserve policy, RiverFront’s investment team remains somewhat cautious in our portfolio positioning. We remain neutral to slightly overweight equities relative to our policy benchmarks, depending on portfolio time horizon and risk tolerance. As rates have moved higher, we plan on being opportunistic regarding adding bond duration to the portfolios.
Risk Discussion: All investments in securities, including the strategies discussed above, include a risk of loss of principal (invested amount) and any profits that have not been realized. Markets fluctuate substantially over time, and have experienced increased volatility in recent years due to global and domestic economic events. Performance of any investment is not guaranteed. In a rising interest rate environment, the value of fixed-income securities generally declines. Diversification does not guarantee a profit or protect against a loss. Investments in international and emerging markets securities include exposure to risks such as currency fluctuations, foreign taxes and regulations, and the potential for illiquid markets and political instability. Please see the end of this publication for more disclosures.
[1] Fed funds futures are liquid monthly contracts that can be used to place bets on or hedge against fluctuations in short-term interest rates.
Important Disclosure Information:
The comments above refer generally to financial markets and not RiverFront portfolios or any related performance. Opinions expressed are current as of the date shown and are subject to change. Past performance is not indicative of future results and diversification does not ensure a profit or protect against loss. All investments carry some level of risk, including loss of principal. An investment cannot be made directly in an index.
Information or data shown or used in this material was received from sources believed to be reliable, but accuracy is not guaranteed.
This report does not provide recipients with information or advice that is sufficient on which to base an investment decision. This report does not take into account the specific investment objectives, financial situation or need of any particular client and may not be suitable for all types of investors. Recipients should consider the contents of this report as a single factor in making an investment decision. Additional fundamental and other analyses would be required to make an investment decision about any individual security identified in this report.
Chartered Financial Analyst is a professional designation given by the CFA Institute (formerly AIMR) that measures the competence and integrity of financial analysts. Candidates are required to pass three levels of exams covering areas such as accounting, economics, ethics, money management and security analysis. Four years of investment/financial career experience are required before one can become a CFA charterholder. Enrollees in the program must hold a bachelor’s degree.
All charts shown for illustrative purposes only. Technical analysis is based on the study of historical price movements and past trend patterns. There are no assurances that movements or trends can or will be duplicated in the future.
Ned Davis Research (NDR) is a global provider of independent investment research, solutions and tools. Founded in 1980, NDR helps clients around the world make objective investment decisions.
Stocks represent partial ownership of a corporation. If the corporation does well, its value increases, and investors share in the appreciation. However, if it goes bankrupt, or performs poorly, investors can lose their entire initial investment (i.e., the stock price can go to zero). Bonds represent a loan made by an investor to a corporation or government. As such, the investor gets a guaranteed interest rate for a specific period of time and expects to get their original investment back at the end of that time period, along with the interest earned. Investment risk is repayment of the principal (amount invested). In the event of a bankruptcy or other corporate disruption, bonds are senior to stocks. Investors should be aware of these differences prior to investing.
In general, the bond market is volatile, and fixed income securities carry interest rate risk. (As interest rates rise, bond prices usually fall, and vice versa). This effect is usually more pronounced for longer-term securities). Fixed income securities also carry inflation risk, liquidity risk, call risk and credit and default risks for both issuers and counterparties. Lower-quality fixed income securities involve greater risk of default or price changes due to potential changes in the credit quality of the issuer. Foreign investments involve greater risks than U.S. investments, and can decline significantly in response to adverse issuer, political, regulatory, market, and economic risks. Any fixed-income security sold or redeemed prior to maturity may be subject to loss.
Index Definitions:
Standard & Poor’s (S&P) 500 Index measures the performance of 500 large cap stocks, which together represent about 80% of the total US equities market.
Personal consumption expenditures (PCE), also known as consumer spending, is a measure of the spending on goods and services by people of the United States. According to the Bureau of Economic Analysis (BEA), a U.S. government agency, PCE accounts for about two-thirds of domestic spending and is a significant driver of gross domestic product (GDP).
The Consumer Price Index (CPI) is a measure that examines the weighted average of prices of a basket of consumer goods and services, such as transportation, food, and medical care. It is calculated by taking price changes for each item in the predetermined basket of goods and averaging them. Changes in the CPI are used to assess price changes associated with the cost of living. The CPI is one of the most frequently used statistics for identifying periods of inflation or deflation.
Definitions:
Gross domestic product (GDP) is a monetary measure of the market value of all final goods and services produced in a period (quarterly or yearly) of time .
The Federal Reserve System (FRS) is the central bank of the United States. Often simply called the Fed, it is arguably the most powerful financial institution in the world. It was founded to provide the country with a safe, flexible, and stable monetary and financial system. The Fed has a board that is comprised of seven members. There are also 12 Federal Reserve banks with their own presidents that represent a separate district.
Fed funds futures are financial futures contracts based on the federal funds rate and traded on the Chicago Mercantile Exchange (CME) operated by CME Group Inc. (CME). The federal funds rate is the rate banks charge each other for overnight loans of reserves on deposit with the Federal Reserve.
The 200-day moving average is a popular technical indicator which investors use to analyze price trends. It is simply a security’s average closing price over the last 200 days.
M2 is the U.S. Federal Reserve’s estimate of the total money supply including all of the cash people have on hand plus all of the money deposited in checking accounts, savings accounts, and other short-term saving vehicles such as certificates of deposit (CDs). Retirement account balances and time deposits above $100,000 are omitted from M2.
Interest rate sensitivity is a measure of how much the price of a fixed-income asset will fluctuate as a result of changes in the interest rate environment. Securities that are more sensitive have greater price fluctuations than those with less sensitivity. This type of sensitivity must be taken into account when selecting a bond or other fixed-income instrument the investor may sell in the secondary market. Interest rate sensitivity affects buying as well as selling.
RiverFront Investment Group, LLC (“RiverFront”), is a registered investment adviser with the Securities and Exchange Commission. Registration as an investment adviser does not imply any level of skill or expertise. Any discussion of specific securities is provided for informational purposes only and should not be deemed as investment advice or a recommendation to buy or sell any individual security mentioned. RiverFront is affiliated with Robert W. Baird & Co. Incorporated (“Baird”), member FINRA/SIPC, from its minority ownership interest in RiverFront. RiverFront is owned primarily by its employees through RiverFront Investment Holding Group, LLC, the holding company for RiverFront. Baird Financial Corporation (BFC) is a minority owner of RiverFront Investment Holding Group, LLC and therefore an indirect owner of RiverFront. BFC is the parent company of Robert W. Baird & Co. Incorporated, a registered broker/dealer and investment adviser.
To review other risks and more information about RiverFront, please visit the website at riverfrontig.com and the Form ADV, Part 2A. Copyright ©2023 RiverFront Investment Group. All Rights Reserved. ID 2773780