By now, you have probably seen the news headlines. In May, inflation rose 8.6% year-over-year, the highest level in four decades, since 1981. Increasing inflation was driven by rapidly rising food and gas prices, which are two areas that directly impact consumers. Looking at airlines, according to Ryan Detrick (a Chartered Market Technician and Chief Market Strategist for LPL), “airfare prices were up 12.6% last month, on the heels of 18.6% the prior month. These are the two highest month-over-month changes ever.” Given some of these snippets, it should not come as a surprise that consumer sentiment has now reached a historic, 85-year low.
Now, onto the markets:
- The markets responded to the inflation news by dropping -2.91% on Friday.
- On Monday morning, June 13th, the S&P 500 was down another -3.87%.
- The S&P 500 is now in that “-20% bear market territory.”
- 20-Year Treasury Bonds were also down -3% on Monday
- In the last 3 days, through mid-morning on Monday, the S&P 500 is down -8.9%. There has been a lot of selling among investors.
Prior to last week, markets had been 100% overbought according to AIQ Trading Expert Pro’s Overbought/Oversold Expert Rating, and therefore expected a decline. Now, through Friday, the S&P 500 is 95% oversold. We would expect that to be nearing 100% after Monday’s close.
The inflation news is not what has driven the markets to this point. We all know what the markets have done this year, and the declines experienced Thursday, Friday, and now Monday have been relatively common in 2022. It was not the news headlines that had driven the markets to this point. In fact, most economists agree that the markets are actually a leading indicator for the economy. In other words, markets often decline before the economic indicators are at their worst and rise prior to signs of economic improvement.
What drives the markets?
So, if the markets lead the economy, then what leads the markets? The answer to that question is “changes in volatility.” Market price fluctuations are a direct result of the actions of buyers and sellers (investors). If demand is greater than supply, prices go up and if supply outweighs demand, prices go down. Bottom line, the beliefs, emotions, and opinions of investors are what drive the markets. These emotions of investors are reflected in the market’s volatility.
Right now, we know that volatility is high, meaning that markets are very emotional. You wouldn’t expect to see a +/-2% day during a low volatility bull market. During today’s environment, it’s starting to feel like the norm. At Canterbury, we are known for our expertise on changes in volatility. Almost every one of our market updates has mentioned rising volatility and how it is a bear market characteristic. In fact, we began to see rising market volatility back in January of this year.
Volatility Chart
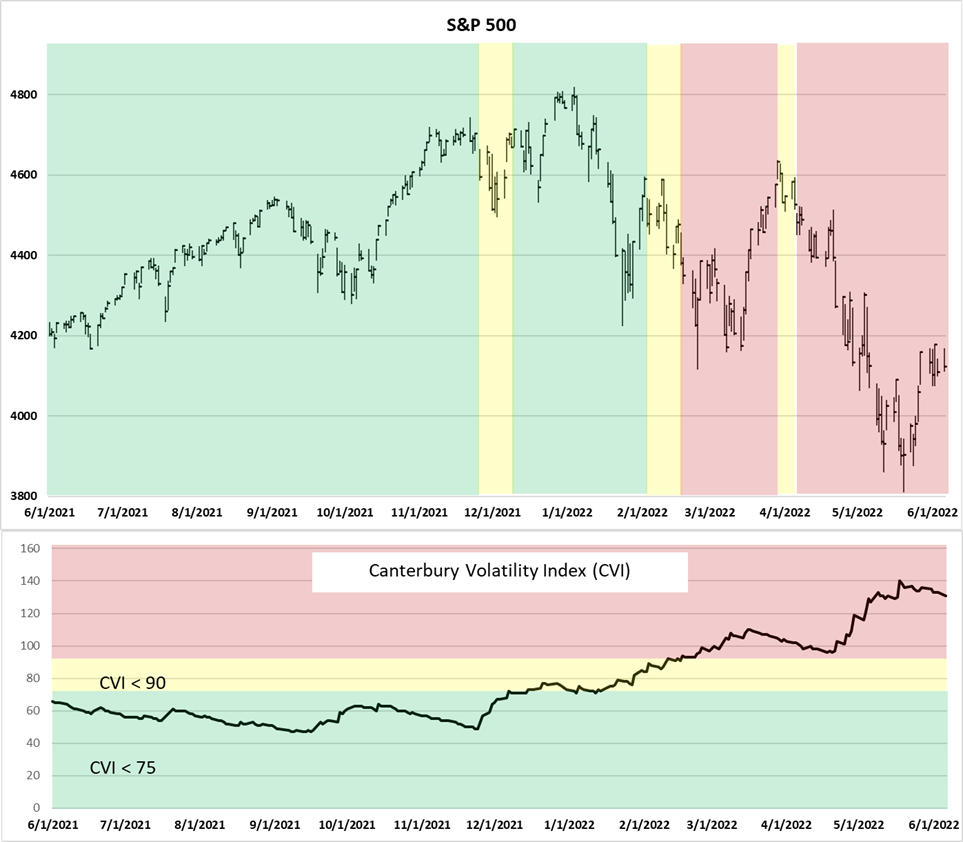
The chart below shows the S&P 500 along with its daily Canterbury Volatility index. For this chart, there are green/yellow/red colored backgrounds. In the top half of the chart, the green background indicates a “bullish” (low risk) market environment; yellow is “transitional” (rising risk); and red is “bearish” (high risk). For the bottom half of the chart, showing the Canterbury Volatility Index (CVI), the green zone is a CVI of 75 or lower. This is generally considered low risk for the market index. A CVI of between 75 and 90 indicates, in this case, rising market risk. A volatility reading above CVI 90 is high risk. Anything can happen in a high-risk environment, such as the one we are seeing today.
Per the chart, you can see that volatility broke above CVI 75 back in December of 2021. The S&P 500 then entered a bearish Market State in mid-to-late February. Through Friday, the CVI of the S&P 500 measured CVI 135.
Bottom Line & What is the plan?
A question that seems to come up with market pundits is “are the markets wrong?” Should the market be higher? Should it go down another -20%? The quick answer to that question, is no, the markets are never wrong. To say it simply, “the markets are what they are.” No one knows where the market will be next week, next month, or next year.
“It’s tough to make predictions, especially about the future”- Yogi Berra
But here is what we know. We know that the markets are volatile. We know that high volatility is a bear market characteristic. We know that in a bear market, the market will be emotional, and it will fluctuate. That fluctuations will come in both directions. Prior to last week, many technical indicators showed the market was overbought. After last week, much of that overbought pressure has been relieved. That does not mean that the market will go up necessarily, but again markets should fluctuate and have large moves in both directions. It is important to not get caught up in the noise of the market, and to focus on the investment process for dealing with a bear market.
Our investment portfolio, the Canterbury Portfolio Thermostat, was designed to deal with and adapt to difficult markets. The Portfolio Thermostat has adapted to the type of environment we have seen in 2022. The portfolio that was effective during a low volatility bull market, is not the same one that will work during a high volatility bear market.
It has made the necessary adjustments to go from dealing with a low volatility bull market to the highly volatile bear we are seeing right now. The portfolio currently holds four inverse positions, which move in the opposite direction of their underlying market securities. In other words, if small cap stocks drop by -1%, the inverse positions should be up about +1%. The purpose of these positions is to help limit portfolio fluctuations. That is what has happened. Now, as the market continues to go through many gyrations, the Portfolio Thermostat will adapt or add holdings to accommodate the changing market conditions as volatility continues to climb or starts to fall.
When dealing with a bear market, like we are seeing today, there is no “safe haven.” The best way to effectively deal with high volatility is through Adaptive Portfolio Management.


