As we have seen over the past three months, emotional and volatile markets will go in both directions, when least expected. This Canterbury Investor Insights update will focus on two current market risks, one from a psychological perspective, and one from a technical perspective.
Risk #1: Investor Psychology- Bearish Sentiment is at a six-year low.
Markets reflect investor emotions. Most of the time, investors act rational, and the result is a stable bull market. Other times, investors are irrational, and the result is a volatile bear market. During volatile markets, investor emotions will fluctuate between extreme optimism and extreme pessimism.
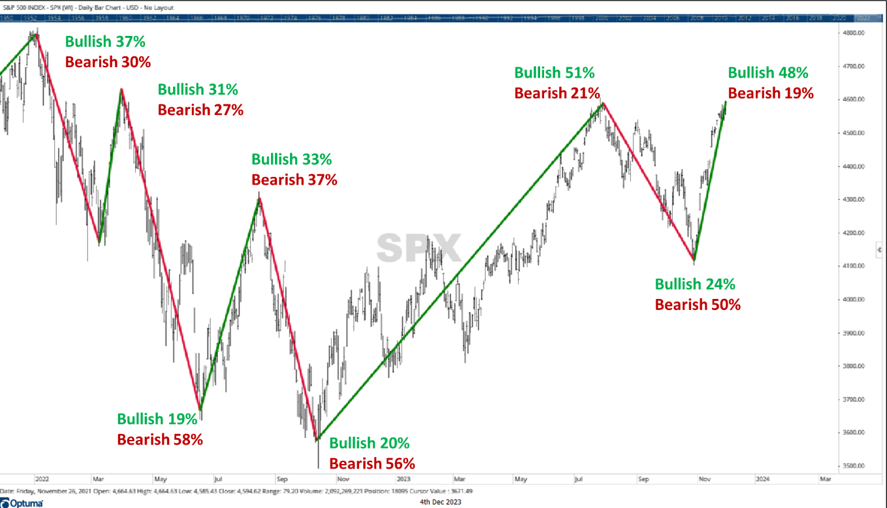
The latest survey results, which are published each Thursday, showed that 48% of investors currently have a positive outlook on the markets, and only 19% of those surveyed had a pessimistic outlook. Here is a quote from the AAII Sentiment Survey Commentary:
“Optimism among individual investors about the short-term outlook for stocks continued to rise in the latest AAII Sentiment Survey. Meanwhile, pessimism decreased to its lowest level in almost six years. Both types of readings have historically been followed by below-average and below-median six-month returns for the S&P 500 index.”
-AAII Investor Sentiment Survey Commentary (Published Nov 30th, 2023)
Pessimism is at its lowest level since January 2018, while optimism is unusually high and just a few percentage points off from its high for the last year. Since the beginning of 2022, investor sentiment has fluctuated between the two extremes, with high optimism/low pessimism preceding declines, and low optimism/high pessimism preceding rallies.
In the chart below, you can see market sentiment at relative peaks and troughs since the beginning of 2022. For reference, during normal bull market years, bullish (positive) and bearish (negative) sentiment have tended to be more balanced. The historical average for each is in the 30-40% range (as it was at the market’s peak near the end of 2021).

Source: Canterbury Investment Management. Chart created using Optuma Technical Analysis Software. Sentiment data is from the AAII Investor Sentiment Survey.
Risk #2: Technical- Many stocks are “overbought”
In markets and liquid securities, we use the terms “overbought” and “oversold” to identify potential pivot points. An “overbought” stock or market is one that has come too far, too fast and is likely to sell off to some degree. An “oversold” stock or market is one that has declined to the point where it is likely to see a bounce.
According to the Relative Strength Index (RSI), which is a technical indicator that measures overbought and oversold conditions, many major indexes are showing overbought conditions. Prior to November’s bounce, this same indicator showed that these indexes were oversold. For the S&P 500 and equal weight S&P 500, the overbought conditions have occurred one other time in 2023, and that was right around the indices’ peak in July, prior to markets declining.
Additionally, many individual stocks are displaying overbought conditions. In fact, looking at the S&P 1500, 20% of its components are overbought. This is the largest percentage of overbought stocks since February. These conditions increase the likelihood of a pullback to relieve some of the overbought pressure.
Bottom Line
As Yogi Berra once said, “it’s tough to make predictions, especially about the future.” Markets just experienced a -10%+ decline followed by a snapback rally. Neither one of those moves is very efficient and goes further to highlight the risks in today’s market.
Right now, many stocks are overbought. Of the market’s 11 sectors, 8 of those sectors are overbought. Overbought conditions often precede pullbacks. Additionally, investors continue to show extreme levels of emotion with each market fluctuation. Investors have gone from extreme optimism to extreme pessimism and back to extreme optimism in just four months. These psychological opinions don’t often occur in stable bull markets. Extreme optimism coupled with extremely low pessimism, or vice versa, is a bear market characteristic.
Market conditions can shift or rotate very quickly in volatile environments. We have seen that happen a few times over the last few months. The bottom line is do not make an emotional decision during an irrational environment. At Canterbury, we continue to evaluate our portfolio holdings and make adjustments to move in concert with the changing market environments.
For more news, information, and analysis, visit the ETF Strategist Channel.

