
Confluence Investment Management offers various asset allocation products which are managed using “top down,” or macro, analysis. We publish asset allocation thoughts on a bi-weekly basis, updating the report every other Monday, along with an accompanying podcast.
Powell’s sudden change of heart may have been related to volatility in the repo market. On December 1, the Secured Overnight Financing Rate (SOFR), a reference rate for transactions of overnight repurchase agreements, skyrocketed to a record high of 5.39% before dropping 8 bps over the next 10 days. A similar event took place nearly two weeks after the FOMC’s mid-December rate decision, as SOFR reached another record high of 5.40% before dropping back to 5.31% over the following days.
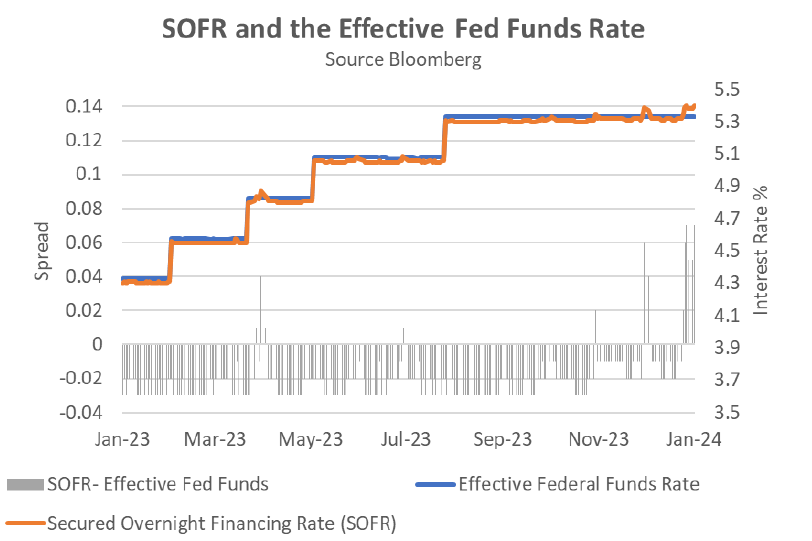
In a stark sign of growing liquidity strains in the financial system, the most recent surge in SOFR pushed its spread over the effective fed funds rate to the widest level since 2020. Because SOFR requires collateral, unlike the unsecured fed funds rate, this spread indicates that banks might be having difficulty finding cheap overnight funding through traditional channels and are seeking the more favorable terms offered by the Fed’s backstop facilities. In December, banks pulled $203 million from the Standing Repo Facility, while borrowings from the Bank Term Funding Program rose to an all-time high of $136 billion.
Beyond the usual end-of-quarter, window-dressing balance sheet adjustments made by many financial institutions, the spike in SOFR is likely caused by underlying issues in the financial system itself. As 2023 was heading for a close, there were signs that the financial system may not be able to absorb the amount of government debt being issued to fund the deficit. In October, Treasury auctions saw weakening demand as investors began demanding higher term premiums to take on more debt. Subsequently, policymakers signaled that they would pause rate hikes indefinitely, hinting at their intent to avoid further dampening of future auction demand.
Recent instability in the repo market raises questions about the Fed’s next move. Following the collapse of Silicon Valley Bank in March, a similar jump in the SOFR/fed funds spread prompted the creation of emergency lending facilities to protect against deposit flight. These targeted programs helped avert a financial crisis by allowing banks to pledge discounted U.S. Treasury and agency debt as collateral at face value in exchange for ultra-cheap loans significantly below the benchmark rate. While this swift action successfully averted a wider financial meltdown, it enlarged the central bank’s balance sheet, making it harder to return to normalcy. Therefore, the Fed has signaled that these facilities will close on March 11 as previously planned.
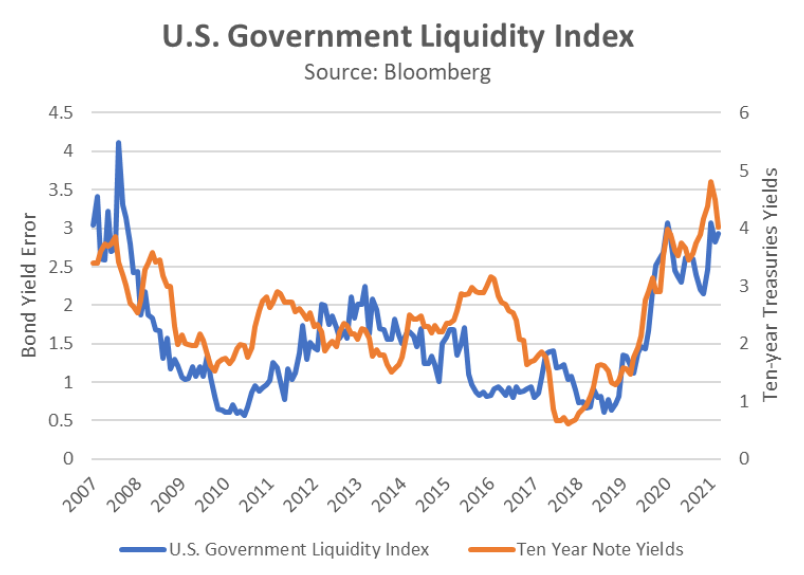
While quantitative easing has been suggested, there are other options that could be more effective and less disruptive to the Fed’s goal of policy normalization. As the chart above shows, the Bloomberg U.S. Government Securities Liquidity Index1, which tracks the yield error of government bonds with maturities of one year or more, has risen in tandem with 10-year Treasury yields to its highest level since 2007. If rising rates is what led to a decrease in government bond liquidity, a decline in rates should have the opposite effect. This potential policy shift might explain some of the current market movements.
In short, although price stability and full employment are core goals of the Federal Reserve, financial stability must be considered an equally crucial objective. This may explain why Jerome Powell’s recent use of the term “restrictive” could hint at a policy rate high enough to cause turbulence in the repo market. While a policy pivot might seem contradictory to the central bank’s fight against inflation, robust financial markets are fundamental to a healthy economy. Fortunately, market forces, fueled by expectations of easing by the Fed, have significantly lowered long-term yields, easing pressure for aggressive stimulus. However, ongoing concerns about the repo market due to Treasury saturation could still leave the door open for increased monetary easing efforts.
1 US Government Securities Liquidity Index: The index GVLQUSD is a measure of prevailing liquidity conditions in the U.S. Treasury market. This index displays the average yield error across the universe of U.S. Treasury notes and bonds with remaining maturity one-year or greater, based off the intra-day Bloomberg relative value curve fitter. When liquidity conditions are favorable, the average yield errors are small as any dislocations from fair value are normalized within a short timeframe. Under stressed liquidity conditions, dislocations from fair value implied by the curve fitter can remain persistent resulting in large average yield errors. CBBT is the pricing source for all Treasury notes and bonds used in this index calculation.
For more news, information, and analysis, visit the ETF Strategist Channel.
Past performance is no guarantee of future results. Information provided in this report is for educational and illustrative purposes only and should not be construed as individualized investment advice or a recommendation. The investment or strategy discussed may not be suitable for all investors. Investors must make their own decisions based on their specific investment objectives and financial circumstances. Opinions expressed are current as of the date shown and are subject to change.
This report was prepared by Confluence Investment Management LLC and reflects the current opinion of the authors. It is based upon sources and data believed to be accurate and reliable. Opinions and forward-looking statements expressed are subject to change. This is not a solicitation or an offer to buy or sell any security.