
By Riverfront Investment Group
As we begin December, it seems appropriate to reflect on the passing of another year. In a few weeks, we will turn the calendar not only to a new year but a new decade. Over the past ten years, we have enjoyed both continued economic growth and strong equity market returns. Despite experiencing these prosperous times, it seems that many are thinking that “all good things must come to an end” as we are frequently asked about the timing of the next recession or the end to the aging bull market. While most of us can look in the mirror and see the aging process, neither economic expansions nor bull markets age in the same linear fashion, so chronology is less important. Additionally, there are concerns about new highs in equity markets. With every new high, strategists are pushed to opine as to how much higher they believe equity markets can rise. Despite not having a crystal ball we do not believe a recession is coming in 2020 and anticipate additional new highs in most indexes over the next 12-months.
RECESSION FEARS PERSIST DESPITE ENCOURAGING DATA
Currently, we believe the differences between slow growth and no growth are enough to keep the US economy limping through the economic expansion despite recessions in other parts of the world. The National Bureau of Economic Research (NBER) is the organization tasked with determining the beginning and end of recessions in the US. Their research uses employment, industrial production, real personal income, and real business sales as data points for determining the health of the US economy. According to the, NBER 3 out of 4 of their indicators show continued growth, as can be seen in the chart below.
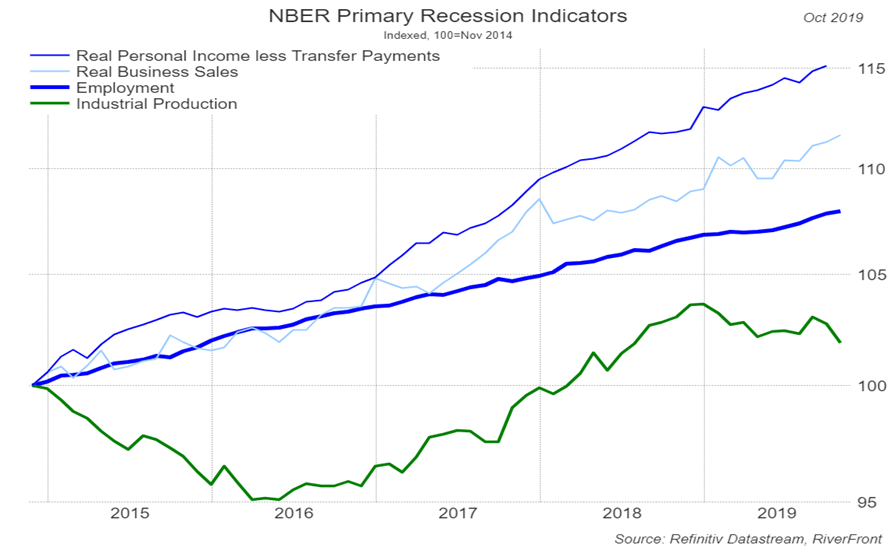
Real personal Income (less transfer payments) continues to grow. Wages continue to rise which is healthy for consumers and healthy for the economy. Recent data suggests wages are growing between 3%-4% in the US as businesses are paying up due to a tighter labor market. While real wage growth is great for consumers, it is not necessarily great for businesses since it negatively impacts profit margins. This helps explain the more sluggish earnings growth companies have experienced in 2019.
Real business sales trends remain positive. Sales, across a wide spectrum of surveys, remain in positive territory. For calendar 2019, analysts are predicting a blended revenue growth rate of 3.8% for companies in the S&P 500, according to FactSet. While 3.8% growth may not be considered robust we believe that slow growth is better over the long-run than unsustainable fast growth or no growth at all. Looking beyond companies in the S&P 500, the National Federation of Independent Business’ most recent report on business trends was also very encouraging as actual sales volumes remained steady. Lastly, retail sales continue to trend positively which is encouraging as we are at the height of the all-important holiday selling season.
Employment trends remain robust. This year, US unemployment fell to 50-year lows of 3.5%. The unemployment rate has also improved dramatically in critical categories such as minorities, youth, and low income. As one can see in the above chart, employment has steadily grown over the past 5 years despite the occasional negative surprise in the monthly non-farm payroll report. Importantly, the current unemployment rate is within the range considered ‘normal’ by the Federal Reserve, which means that the Fed is unlikely to reverse their accommodative stance because they are worried about the economy overheating, in our view.
Industrial Production has drifted lower. This data point has proven to be the wet blanket of the four indicators watched by the NBER as it has been zig-zagging over the past few months. After slumping in July and rebounding in August, the September and October data fell more than expected. Analysts blame a loss of momentum in manufacturing as being the culprit, which many believe is a function of the ongoing trade tensions. It is no secret that resolution to the trade tensions across the globe, not just with China, could have positive implications for global growth.
WHICH NEW MARKET HIGH WILL BE THE HIGH?

S&P 500 200-Day Moving Average
While there are many economic data points that analysts use to call a recession, a market top is more difficult. Valuations are subjective and there is no one technical indicator that is considered the best. In 2019, there have been around 20 new highs – depending on the index being referenced. We view November’s string of new highs on the S&P 500 as a technical positive and note that developed international indexes have also moved above some important resistance levels. Another technical indicator that we use compares the number of new highs to the number of new lows, commonly called a breadth indicator, is also positive on the S&P 500 at this time. While our near-term overhead target is around 3200 for the S&P 500, we believe it can exceed that level as we are in, what is typically, a positive period seasonally.
WHAT DOES IT ALL MEAN?
Ideally, we would like to see each of the four NBER economic indicators moving in a positive direction. However, not every indicator has to be improving for the US economy to continue to expand. Recessions are generally declared, after the fact, in hindsight. We continue to be encouraged by the 3 out of 4 indicators that remain positive and our strategies reflect that cautious optimism. We believe our tactical market signals confirm our fundamental views, so we expect to turn our calendar to a new year and a new decade poised for continued market strength and reaccelerating economic growth.
This article was written by the team at RiverFront Investment Group, a participant in the ETF Strategist Channel.
Important Disclosure Information
The comments above refer generally to financial markets and not RiverFront portfolios or any related performance. Past results are no guarantee of future results and no representation is made that a client will or is likely to achieve positive returns, avoid losses, or experience returns like those shown or experienced in the past.
Information or data shown or used in this material is for illustrative purposes only and was received from sources believed to be reliable, but accuracy is not guaranteed.
In a rising interest rate environment, the value of fixed-income securities generally declines.
Technical analysis is based on the study of historical price movements and past trend patterns. There are no assurances that movements or trends can or will be duplicated in the future.
Investing in foreign companies poses additional risks since political and economic events unique to a country or region may affect those markets and their issuers. In addition to such general international risks, the portfolio may also be exposed to currency fluctuation risks and emerging markets risks as described further below.
Changes in the value of foreign currencies compared to the U.S. dollar may affect (positively or negatively) the value of the portfolio’s investments. Such currency movements may occur separately from, and/or in response to, events that do not otherwise affect the value of the security in the issuer’s home country. Also, the value of the portfolio may be influenced by currency exchange control regulations. The currencies of emerging market countries may experience significant declines against the U.S. dollar, and devaluation may occur subsequent to investments in these currencies by the portfolio.
Foreign investments, especially investments in emerging markets, can be riskier and more volatile than investments in the U.S. and are considered speculative and subject to heightened risks in addition to the general risks of investing in non-U.S. securities. Also, inflation and rapid fluctuations in inflation rates have had, and may continue to have, negative effects on the economies and securities markets of certain emerging market countries.
Stocks represent partial ownership of a corporation. If the corporation does well, its value increases, and investors share in the appreciation. However, if it goes bankrupt, or performs poorly, investors can lose their entire initial investment (i.e., the stock price can go to zero). Bonds represent a loan made by an investor to a corporation or government. As such, the investor gets a guaranteed interest rate for a specific period of time and expects to get their original investment back at the end of that time period, along with the interest earned. Investment risk is repayment of the principal (amount invested). In the event of a bankruptcy or other corporate disruption, bonds are senior to stocks. Investors should be aware of these differences prior to investing.
Standard & Poor’s (S&P) 500 Index measures the performance of 500 large cap stocks, which together represent about 80% of the total US equities market.
It is not possible to invest directly in an index.
RiverFront Investment Group, LLC, is an investment adviser registered with the Securities Exchange Commission under the Investment Advisers Act of 1940. Registration as an investment adviser does not imply any level of skill or expertise. The company manages a variety of portfolios utilizing stocks, bonds, and exchange-traded funds (ETFs). RiverFront also serves as sub-advisor to a series of mutual funds and ETFs. Opinions expressed are current as of the date shown and are subject to change. They are not intended as investment recommendations.
RiverFront is owned primarily by its employees through RiverFront Investment Holding Group, LLC, the holding company for RiverFront. Baird Financial Corporation (BFC) is a minority owner of RiverFront Investment Holding Group, LLC and therefore an indirect owner of RiverFront. BFC is the parent company of Robert W. Baird & Co. Incorporated (“Baird”), a registered broker/dealer and investment adviser.
Copyright ©2019 RiverFront Investment Group. All Rights Reserved. 1025352
