
By Dan Zolet, CFA
SUMMARY
- We expect inflation and rates to remain higher than the last decade.
- We favor tech within growth and cyclicals within value.
- Specifically, we focus on cash flow generation in both groups.
As we discussed earlier this month in our “3 Rules” update, we believe that the Federal Reserve will remain hawkish in their rate targets, despite falling inflation. Last week, the July CPI report saw a slight increase compared to June, but the 3.2% year-over-year number is a far cry from the increases the economy was experiencing last year. Taking the current level of both interest rates and inflation into account, this week we want to shine light on how both affect growth-oriented stocks and value-oriented stocks. Given that we believe economic growth in the US will remain positive and interest rates and inflation will remain at more elevated levels for longer than the consensus expects, our goal is to connect recent headlines on Inflation and the Fed to our equity positioning.
Technology Stocks Thrive on Normalized Interest Rates
To understand growth investing today, we must first discuss how growth stocks have changed over the past decade. In July 2013, Information Technology made up approximately 19.6% of the S&P 500 Growth index. Fast forward to July 2023 and the sector now consists of 36.9% of the same index. Thus, we believe understanding the technology sector has become the key to growth investing.
With our focus set on the tech sector, we think the yield on the 10-year Treasury note has a big impact for two reasons. First, tech stocks generate a greater proportion of their earnings in the future, and rising interest rates allow investors to earn more from bonds and cash immediately making those future earnings comparatively less valuable. Second, the earnings of these stocks have benefited substantially from share buyback activity, which is often funded through debt which becomes more expensive to service as rates rise. Now that Fed tightening is almost over, this source of earning-per-share growth for Tech stocks has abated. Chart 1 illustrates the relationship between Tech stocks and interest rates.
Chart 1: S&P 500 Technology Returns vs US 10-Year rates – 2022 to Present.
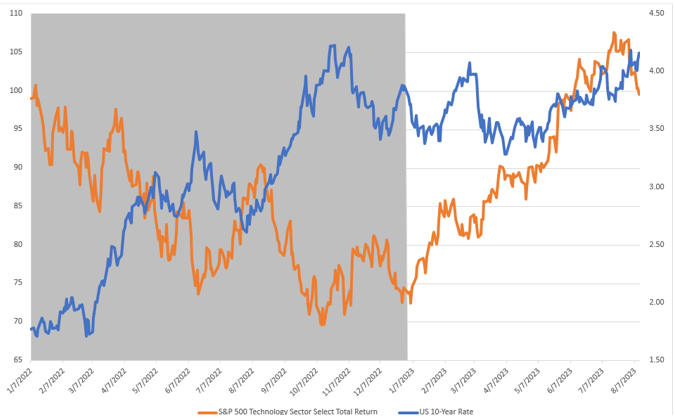
Source: FactSet, RiverFront; Data daily as of August 11, 2023. Charts shown for illustrative purposes. Not indicative of RiverFront’s portfolio performance. Past performance is no guarantee of future results. An Investment cannot be made directly In an Index.
In 2022 (the shaded area in chart 1), the US 10-year rose 2.24 percentage points from a yield of 1.63 on January 3, 2022, to 3.87 on December 30, 2022. In this same period, the S&P 500 Technology Select Sector index total return was -25.46%. In our opinion, this performance was driven both by the direct impact of the interest rate shift and concerns that higher rates would put a dent in technology companies’ earnings. However, when we shift our attention to 2023 YTD returns (the nonshaded area in chart 1), yields have moved more sideways, and returns have been able to rebound as earnings and profit margins have held in better than was initially feared.
As the market comes to terms with the reality of higher rates for longer than expected, we believe it is important to be selective in growth investing in general, and in technology investing in particular. In our view, the technology sector can be divided into more speculative, ‘future-growth’ companies and companies that generate cash flow currently. We prefer the latter, specifically technology stocks with positive, steady current cash flows that are meaningfully higher than their cost of capital. We find these characteristics in many of the largest Technology companies.
Cyclical Sectors Do Better When Inflation is Above Average, but Stable
We believe that, as the Fed intends, higher rates will cool the economy. In fact, that process has already begun in some places, and will continue to do so over the next year. This means that the higher inflation we’ve seen over the past 18 months is likely to, and has already begun to, subside. However, off the back of a strong labor market, which we expect to continue, we believe that inflation is likely to remain between 3-4%, a rate much higher than the last 15 years, but not hyperinflationary by any measure. In fact, we believe it is this environment of moderate inflation where value-oriented equities thrive. Specifically, it is cyclical stocks which we define as those comprising the industrial, energy, and materials sectors, that enjoy this moderate inflation, in our view.
These cyclical stocks have an interesting relationship with inflation. We believe that when inflation runs too hot for too long, cyclical-oriented companies struggle to consistently pass those costs to customers. Additionally, since many cyclical companies are also dividend payers, higher inflation increases the attractiveness of substitutes, like bonds, money market funds and bank CD’s. On the other hand, when inflation is too low, non-financial, cyclical-oriented companies cannot grow their sales fast enough to cover their fixed costs. Below in chart 2, we can see this:
Chart 2: Inflations effects on average Monthly S&P Energy, Industrials, and Materials Select Sector Index returns since 2013.
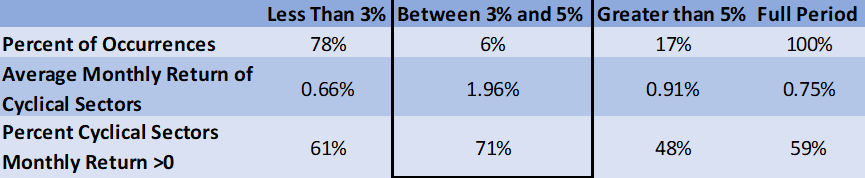
Source: FactSet, RiverFront; Data monthly as of August 11, 2023. Charts shown for illustrative purposes. Not indicative of RiverFront portfolio performance. Past performance is no guarantee of future results.
The second column (bordered in Chart 2) represents months when inflation was between 3% and 5% (not too hot and not too cold). While this inflation zone occurred only 6% of the time, when inflation was between 3% and 5%, it provided the best average monthly return for an equal-weighted combination of the S&P Energy, Industrial, and Materials Select Sector Index and the best “hit rate,” or percent of months with a positive return over the time period. Moving forward, we believe that the federal reserve’s efforts to curtail inflation set up for a prolonged period in the 3-5% range for inflation, as it has over the past four inflation reports. This prediction is consistent with the post-World War II regime that allowed the government to reduce its debt burden through a protracted period of nominal growth and long-term interest rates below the rate of inflation.
Despite these favorable tailwinds, cyclical companies face their own unique challenges, so we believe that being selective in our purchases is as critical as it is for Growth companies. As part of our selection process, we attempt to identify cyclical-oriented companies that can pass higher prices on to their customers. Those companies that can, we find possess profit-focused management teams, clean balance sheets, and strong, growing cash flows. We are aware that an absence of profitability in this sector can quickly turn “value” into a value trap and are thus steering clear of companies that lack the ability to grow earnings. We also recognize that volatility is still a hallmark of value investing, so we expect lots of bumps in the road even for our successful investments.
Conclusion
Higher interest rates have ushered in alternatives to stocks. As such, we believe that it is prudent for investors to take a more balanced approach; by having exposure to both growth style companies and value equities. However, we also believe investors must be aware of each style’s pitfalls in an environment of higher rates and inflation, leaning on security selection within each style. We apply this philosophy to both our short and long horizon portfolios. In our shorter horizon portfolios, we focus our selection on favoring sectors, industries, and themes within growth and value with the characteristics we are looking for. In the longer horizon portfolios, we use the investor’s higher tolerance for tracking error to be even more selective, employing more industry and stock specific exposures.
Important Disclosure Information:
The comments above refer generally to financial markets and not RiverFront portfolios or any related performance. Opinions expressed are current as of the date shown and are subject to change. Past performance is not indicative of future results and diversification does not ensure a profit or protect against loss. All investments carry some level of risk, including loss of principal. An investment cannot be made directly in an index.
Information or data shown or used in this material was received from sources believed to be reliable, but accuracy is not guaranteed.
This report does not provide recipients with information or advice that is sufficient on which to base an investment decision. This report does not take into account the specific investment objectives, financial situation or need of any particular client and may not be suitable for all types of investors. Recipients should consider the contents of this report as a single factor in making an investment decision. Additional fundamental and other analyses would be required to make an investment decision about any individual security identified in this report.
Chartered Financial Analyst is a professional designation given by the CFA Institute (formerly AIMR) that measures the competence and integrity of financial analysts. Candidates are required to pass three levels of exams covering areas such as accounting, economics, ethics, money management and security analysis. Four years of investment/financial career experience are required before one can become a CFA charterholder. Enrollees in the program must hold a bachelor’s degree.
All charts shown for illustrative purposes only. Technical analysis is based on the study of historical price movements and past trend patterns. There are no assurances that movements or trends can or will be duplicated in the future.
Stocks represent partial ownership of a corporation. If the corporation does well, its value increases, and investors share in the appreciation. However, if it goes bankrupt, or performs poorly, investors can lose their entire initial investment (i.e., the stock price can go to zero). Bonds represent a loan made by an investor to a corporation or government. As such, the investor gets a guaranteed interest rate for a specific period of time and expects to get their original investment back at the end of that time period, along with the interest earned. Investment risk is repayment of the principal (amount invested). In the event of a bankruptcy or other corporate disruption, bonds are senior to stocks. Investors should be aware of these differences prior to investing.
In general, the bond market is volatile, and fixed income securities carry interest rate risk. (As interest rates rise, bond prices usually fall, and vice versa). This effect is usually more pronounced for longer-term securities). Fixed income securities also carry inflation risk, liquidity risk, call risk and credit and default risks for both issuers and counterparties. Lower-quality fixed income securities involve greater risk of default or price changes due to potential changes in the credit quality of the issuer. Foreign investments involve greater risks than U.S. investments, and can decline significantly in response to adverse issuer, political, regulatory, market, and economic risks. Any fixed-income security sold or redeemed prior to maturity may be subject to loss.
Index Definitions:
Standard & Poor’s (S&P) 500 Index measures the performance of 500 large cap stocks, which together represent about 80% of the total US equities market.
The Consumer Price Index (CPI) is a measure that examines the weighted average of prices of a basket of consumer goods and services, such as transportation, food, and medical care. It is calculated by taking price changes for each item in the predetermined basket of goods and averaging them. Changes in the CPI are used to assess price changes associated with the cost of living. The CPI is one of the most frequently used statistics for identifying periods of inflation or deflation.
Definitions:
Treasuries: government debt securities issued by the US Government. Treasury securities typically pay less interest than other securities in exchange for lower default or credit risk. With relatively low yields, income produced by Treasuries may be lower than the rate of inflation.
Technology and internet-related stocks, especially of smaller, less-seasoned companies, tend to be more volatile than the overall market.
RiverFront Investment Group, LLC (“RiverFront”), is a registered investment adviser with the Securities and Exchange Commission. Registration as an investment adviser does not imply any level of skill or expertise. Any discussion of specific securities is provided for informational purposes only and should not be deemed as investment advice or a recommendation to buy or sell any individual security mentioned. RiverFront is affiliated with Robert W. Baird & Co. Incorporated (“Baird”), member FINRA/SIPC, from its minority ownership interest in RiverFront. RiverFront is owned primarily by its employees through RiverFront Investment Holding Group, LLC, the holding company for RiverFront. Baird Financial Corporation (BFC) is a minority owner of RiverFront Investment Holding Group, LLC and therefore an indirect owner of RiverFront. BFC is the parent company of Robert W. Baird & Co. Incorporated, a registered broker/dealer and investment adviser.
To review other risks and more information about RiverFront, please visit the website at riverfrontig.com and the Form ADV, Part 2A. Copyright ©2023 RiverFront Investment Group. All Rights Reserved. ID 3060565
For more news, information, and analysis, visit the ETF Strategist Channel.
