

By: Matthew Poterba, CFA, Senior Analyst
Valuation alone may not be a reliable short-term timing indicator, but crowded and overvalued markets have a greater risk of disappointment. Today, investors are generally ignoring global stocks and have increasingly crowded into a handful of very expensive US stocks. Because valuation is a prime determinant of long-term returns, these ignored market segments stand to benefit as sentiment begins to normalize.
Investors are crowding US equities
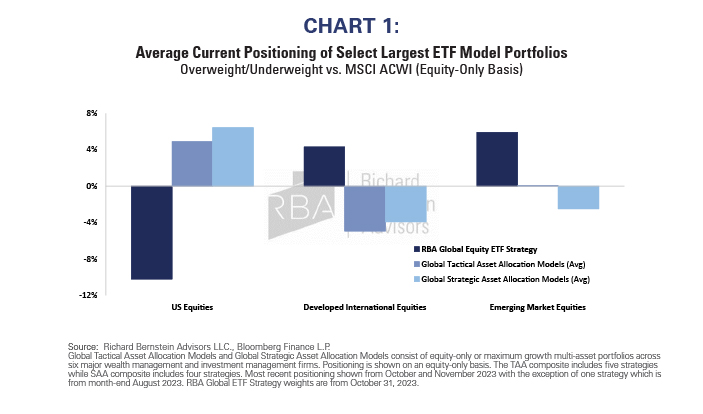
Many portfolios reflect what has worked best in the last decade rather than what may work going forward. Chart 1 shows the average equity positioning across six selected large tactical asset allocation and strategic asset allocation portfolios. Relative to the global equity market, these strategies are significantly overweight the US at the expense of International Developed and Emerging Market stocks.
RBA’s Global Equity ETF Strategy appears positioned dramatically different than consensus. We are meaningfully underweight the US and see significant opportunities outside the US.
Most stocks around the world look cheap
During periods of heightened investor interest, such as the current focus on the ‘Magnificent 7,’ stocks’ valuations can soar beyond sustainable levels. Conversely, less popular markets may be undervalued. Over longer time horizons these valuation extremes typically correct as market conditions stabilize and investor sentiment adjusts. Equity valuations tend to behave like a rubber band, heavily influenced by investor psychology and sentiment.
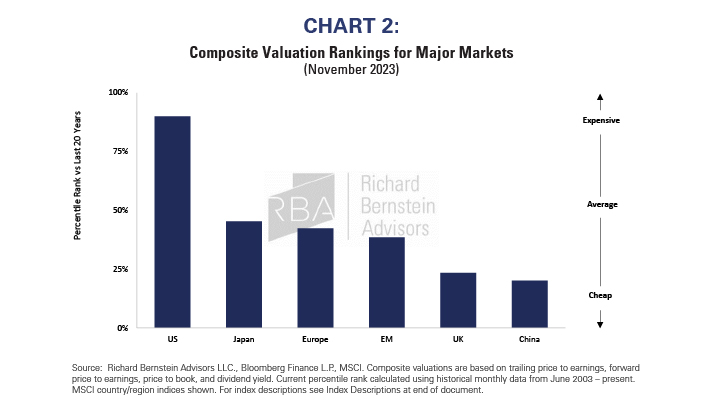
Although these reversions to fair value may not occur overnight, valuations do act as an anchor – gradually pulling stock prices toward their intrinsic value. Therefore, this would suggest that US market segments with the richest valuations today are likely to underperform over time. Similarly, undervalued US and international market segments are poised to rise as depressed valuations revert higher toward more normal levels (Chart 2).
US Stocks: A Tale of Two Markets
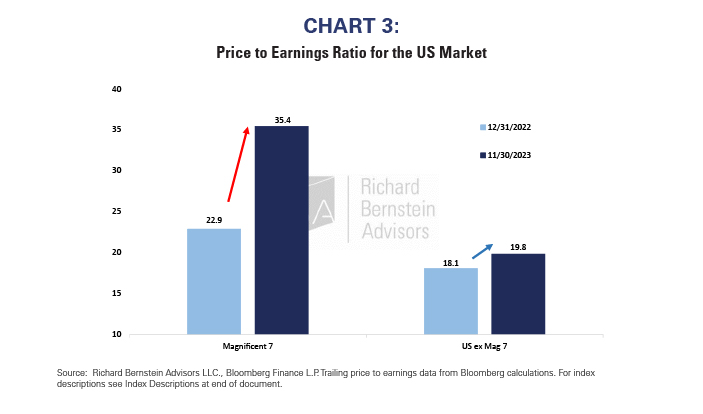
While the US market appears expensive on the index level, aggregate market statistics hide what could be a historic range of valuations. The ‘Magnificent 7’ dominate standard indices and look very expensive, and their weights in the major indices skew index valuation upward. Yet the vast majority of US stocks are relatively cheap. This stark valuation bifurcation has gotten more pronounced throughout 2023 (Chart 3).
Looking past the expensive ‘Magnificent 7’ reveals many undervalued opportunities across the US and international markets. This divergence highlights potential risks of crowding into already expensive stocks and underscores the prospects of overlooked areas. As valuation differences normalize, capitalizing on these out-of-consensus opportunities may reward investors willing to deviate from the herd.
It’s impossible to predict when the valuation rubber band will contract (or snap?). However, the glut of capital rushing to such a small universe of stocks strongly suggests the universe of investment opportunities is much broader than simply 7 stocks.
INDEX DESCRIPTIONS:
The following descriptions, while believed to be accurate, are in some cases abbreviated versions of more detailed or comprehensive definitions available from the sponsors or originators of the respective indices. Anyone interested in such further details is free to consult each such sponsor’s or originator’s website.
The past performance of an index is not a guarantee of future results.
Each index reflects an unmanaged universe of securities without any deduction for advisory fees or other expenses that would reduce actual returns, as well as the reinvestment of all income and dividends. An actual investment in the securities included in the index would require an investor to incur transaction costs, which would lower the performance results. Indices are not actively managed and investors cannot invest directly in the indices.
Magnificent 7: Bloomberg Magnificent 7 Index. The Bloomberg Magnificent 7 Total Return Index is an equal-dollar weighted equity benchmark consisting of a fixed basket of 7 widely-traded companies classified in the United States and representing the Communications, Consumer Discretionary and Technology sectors.
US ex Mag 7: Bloomberg US Large Cap ex Magnificent 7. The Bloomberg US Large Cap ex Magnificent 7 Total Return Index is a float market-cap weighted benchmark designed to measure the most highly capitalized US companies, while excluding securities whose parent company is an index member of the Bloomberg Magnificent 7 Index.
ACWI®: MSCI All Country World Index. The MSCI ACWI® Index is a free-float-adjusted, market-capitalization-weighted index designed to measure the equity-market performance of global developed and emerging markets.
Europe: MSCI Europe Index: The MSCI Europe Index is a free-float-adjusted, market-capitalization-weighted index designed to measure the equity-market performance of Europe developed markets.
US: MSCI USA Index: The MSCI USA Index is a free-float-adjusted, market-capitalization-weighted index designed to measure the equity-market performance of the United States.
UK: MSCI United Kingdom (UK) Index: The MSCI United Kingdom Index is a free-float-adjusted, market-capitalization-weighted index designed to measure the equity-market performance of the United Kingdom.
Japan: MSCI Japan Index: The MSCI Japan Index is a free-float-adjusted, market-capitalization-weighted index designed to measure the equity-market performance of Japan.
EM: MSCI Emerging Markets Index: The MSCI Emerging Markets Index is a free-float-adjusted, market-capitalization-weighted index designed to measure the equity-market performance of global emerging markets.
China: MSCI China Index: The MSCI China Index is a free-float-adjusted, market-capitalization-weighted index designed to measure the equity-market performance of China.
About Richard Bernstein Advisors
Richard Bernstein Advisors LLC is an investment manager focusing on long-only, global equity and asset allocation investment strategies. RBA runs ETF asset allocation SMA portfolios at leading wirehouses, independent broker/dealers, TAMPS and on select RIA platforms. Additionally, RBA partners with several firms including Eaton Vance Corporation and First Trust Portfolios LP, and currently has $15.0 billion collectively under management and advisement as of September 30, 2023. RBA acts as sub‐advisor for the Eaton Vance Richard Bernstein Equity Strategy Fund, the Eaton Vance Richard Bernstein All‐Asset Strategy Fund and also offers income and unique theme-oriented unit trusts through First Trust. RBA is also the index provider for the First Trust RBA American Industrial Renaissance® ETF. RBA’s investment insights as well as further information about the firm and products can be found at www.RBAdvisors.com.
Nothing contained herein constitutes tax, legal, insurance or investment advice, or the recommendation of or an offer to sell, or the solicitation of an offer to buy or invest in any investment product, vehicle, service or instrument. Such an offer or solicitation may only be made by delivery to a prospective investor of formal offering materials, including subscription or account documents or forms, which include detailed discussions of the terms of the respective product, vehicle, service or instrument, including the principal risk factors that might impact such a purchase or investment, and which should be reviewed carefully by any such investor before making the decision to invest. RBA information may include statements concerning financial market trends and/or individual stocks, and are based on current market conditions, which will fluctuate and may be superseded by subsequent market events or for other reasons. Historic market trends are not reliable indicators of actual future market behavior or future performance of any particular investment which may differ materially, and should not be relied upon as such. The investment strategy and broad themes discussed herein may be inappropriate for investors depending on their specific investment objectives and financial situation. Information contained in the material has been obtained from sources believed to be reliable, but not guaranteed. You should note that the materials are provided “as is” without any express or implied warranties. Past performance is not a guarantee of future results. All investments involve a degree of risk, including the risk of loss. No part of RBA’s materials may be reproduced in any form, or referred to in any other publication, without express written permission from RBA. Links to appearances and articles by Richard Bernstein, whether in the press, on television or otherwise, are provided for informational purposes only and in no way should be considered a recommendation of any particular investment product, vehicle, service or instrument or the rendering of investment advice, which must always be evaluated by a prospective investor in consultation with his or her own financial adviser and in light of his or her own circumstances, including the investor’s investment horizon, appetite for risk, and ability to withstand a potential loss of some or all of an investment’s value. Investing is subject to market risks. Investors acknowledge and accept the potential loss of some or all of an investment’s value. Views represented are subject to change at the sole discretion of Richard Bernstein Advisors LLC. Richard Bernstein Advisors LLC does not undertake to advise you of any changes in the views expressed herein.
© Copyright 2023 Richard Bernstein Advisors LLC. All rights reserved.
PAST PERFORMANCE IS NO GUARANTEE OF FUTURE RESULTS
For more news, information, and analysis, visit the ETF Strategist Channel.