
By Rob Williams, Director of Research, Sage Advisory
The three key questions on every fixed income investor’s mind are
- Where are interest rates going?
- What do fixed income returns look like, both in the short-term and long-term?
- What are the best strategies to be in given these dynamics?
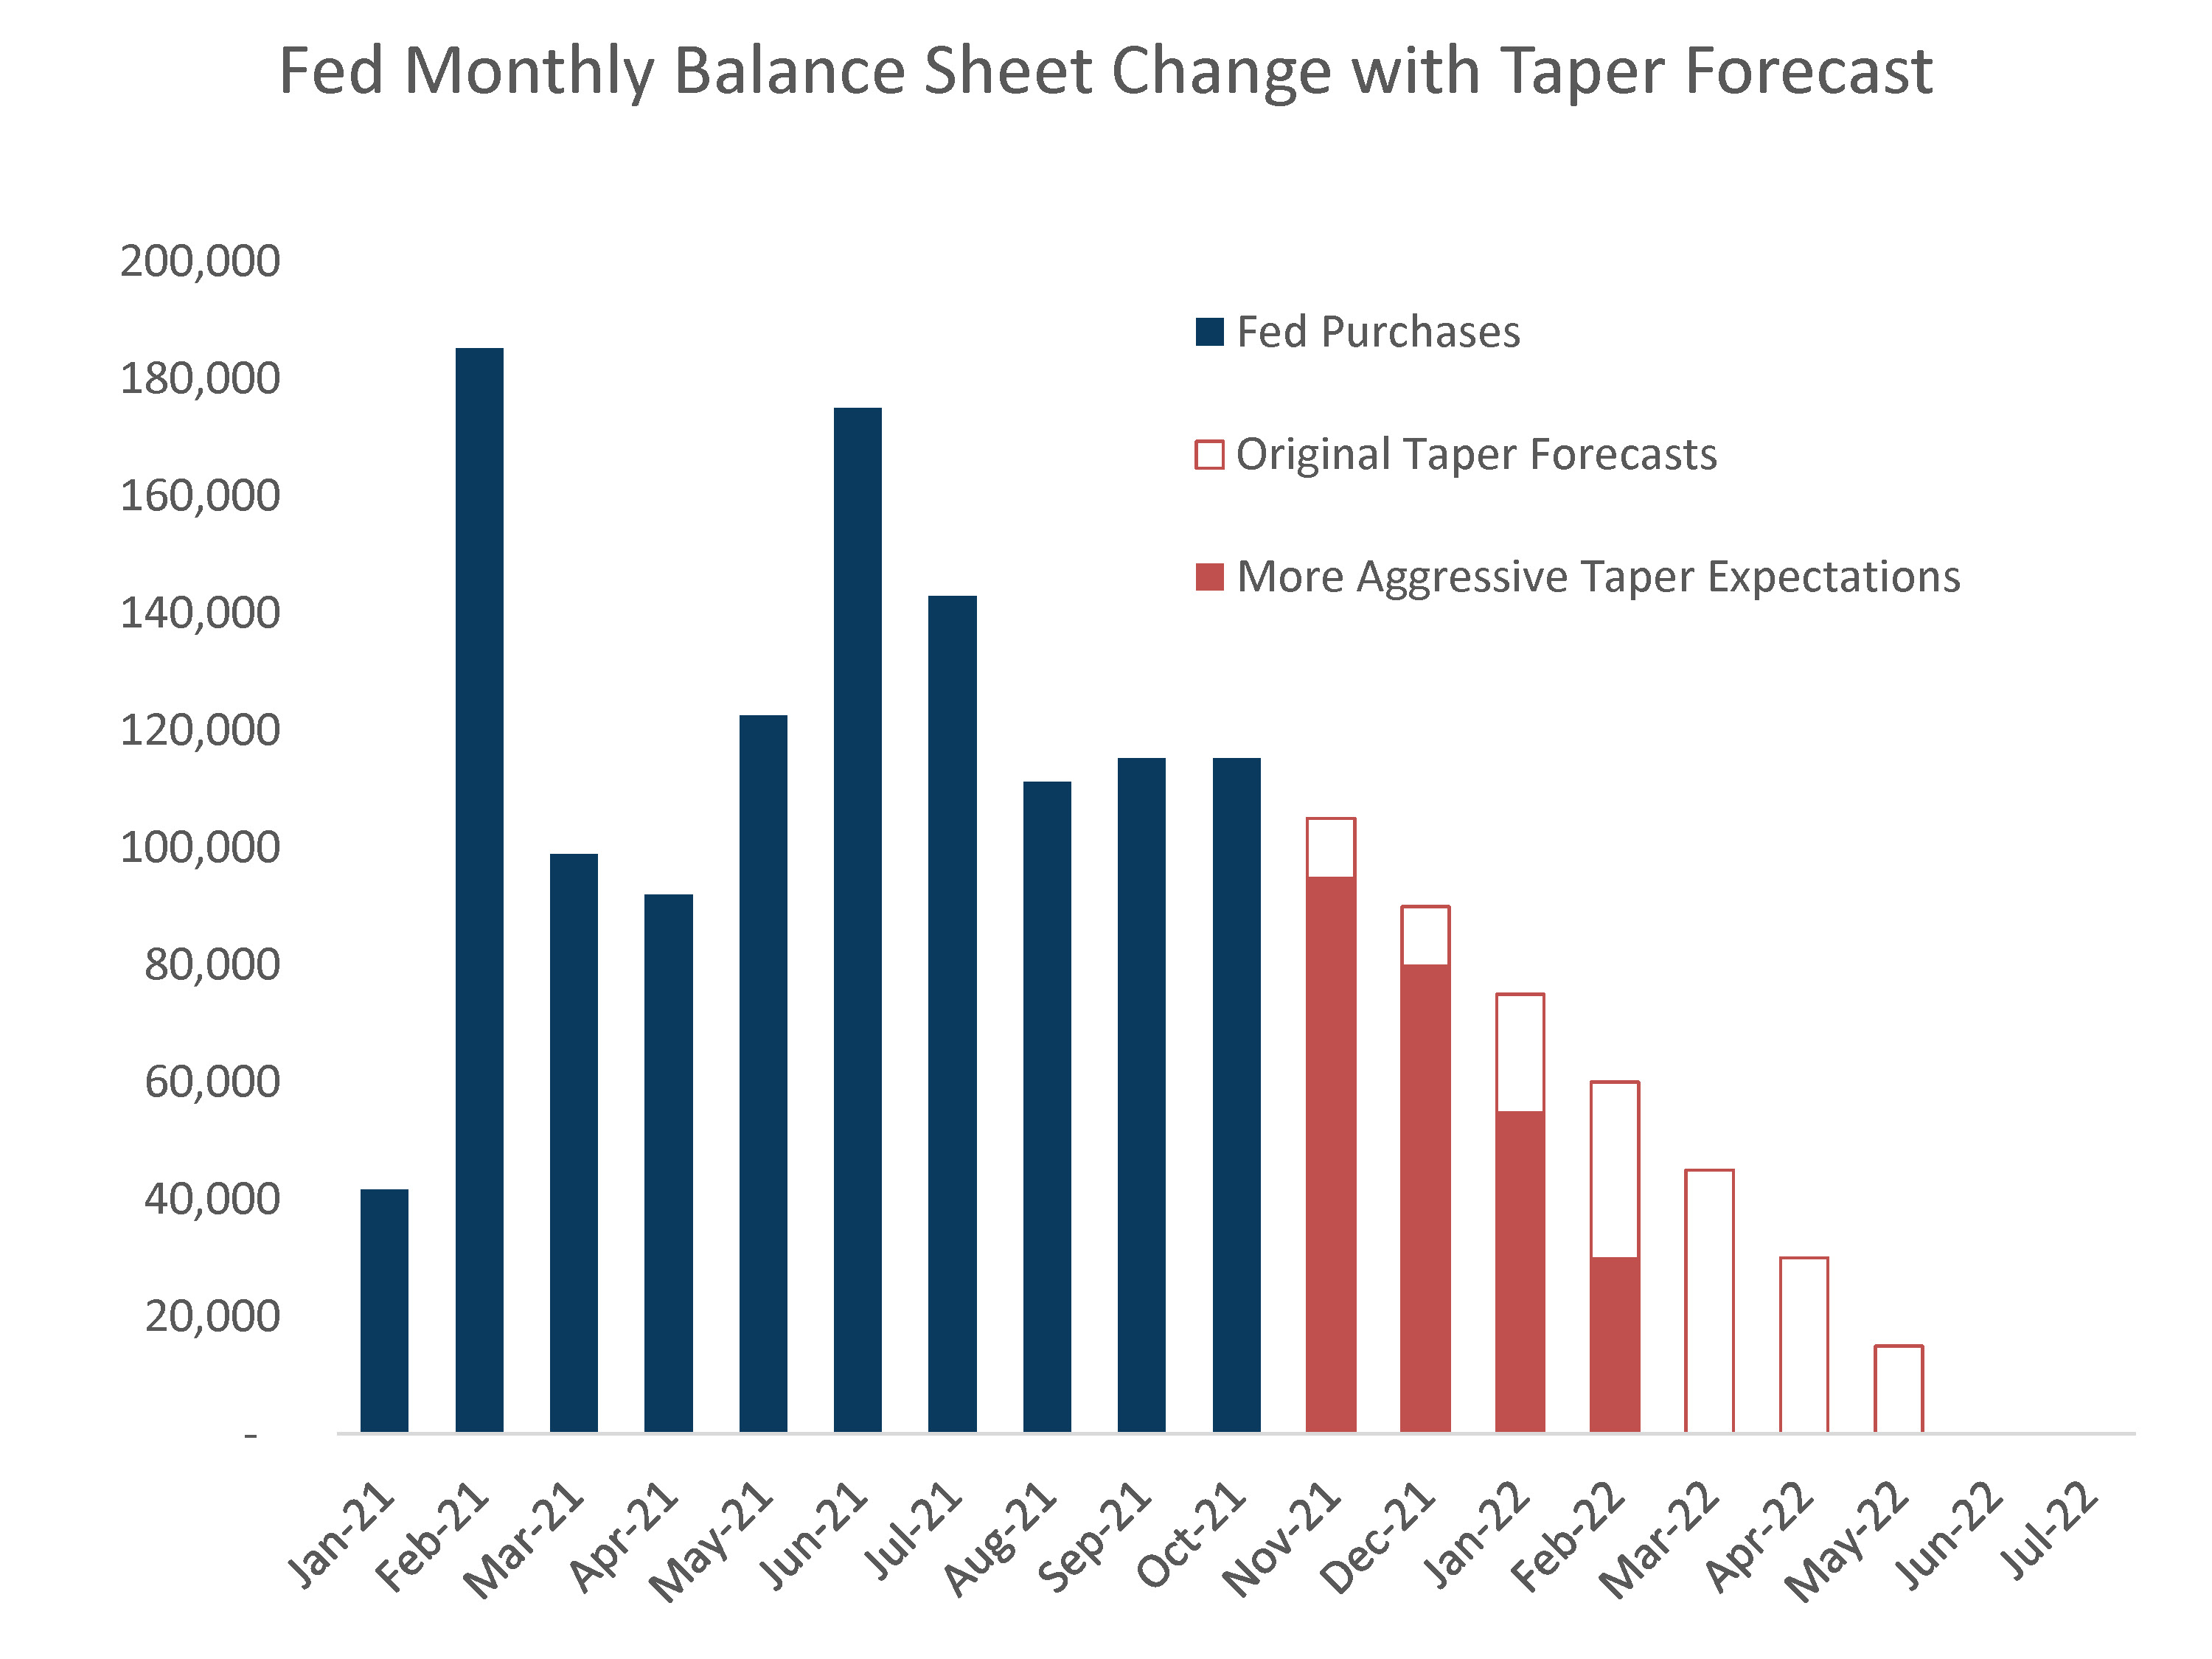
The Fed has become more hawkish, with a shorter taper timeline followed by immediate hikes and possible balance sheet reductions later in 2022. The following chart illustrates original expectations were for tapering to begin in November of last year and end in May of this year. The Fed has embarked on an accelerated taper schedule predicted to end by March 2022, followed by interest rate hikes.
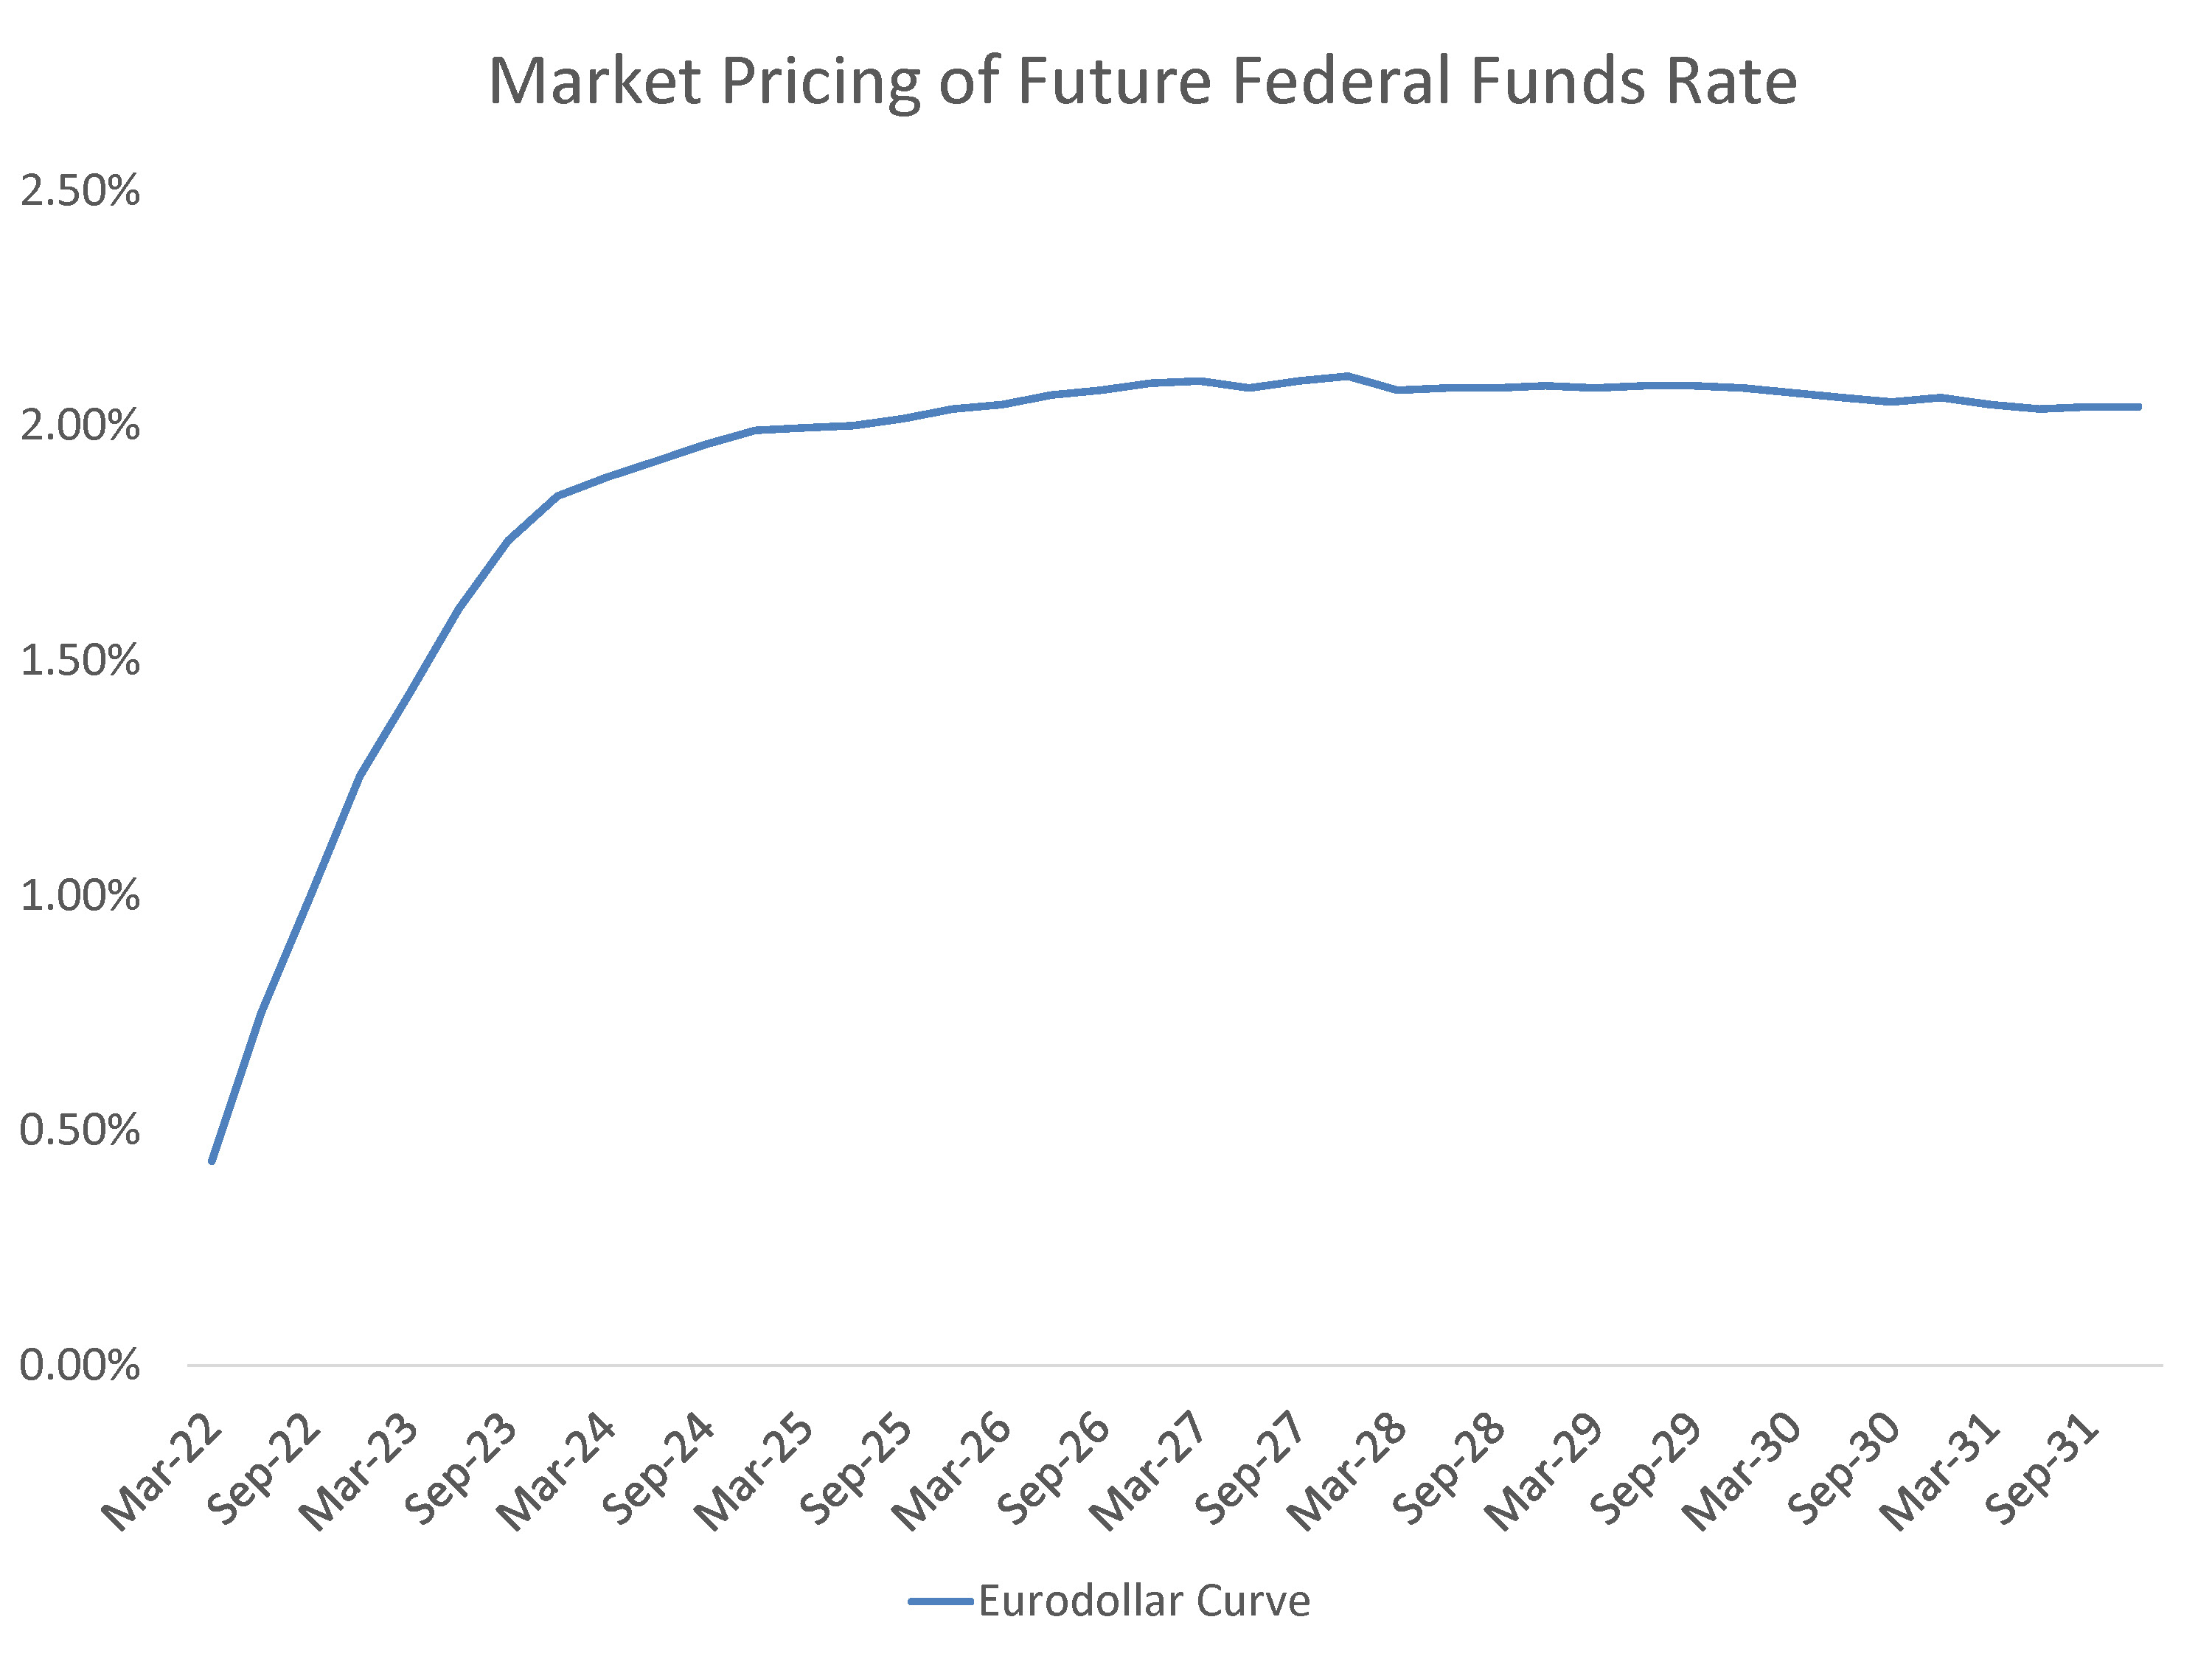
Rates have priced in a good portion of the Fed’s timetable – which is four hikes in 2022 and three to four hikes in 2023 – moving rapidly into the 1.75% to 2.00% range we expected. Rates may be more stable near-term as markets await the follow-through, but they will still be under pressure to move higher ahead of tightening in mid-2022.
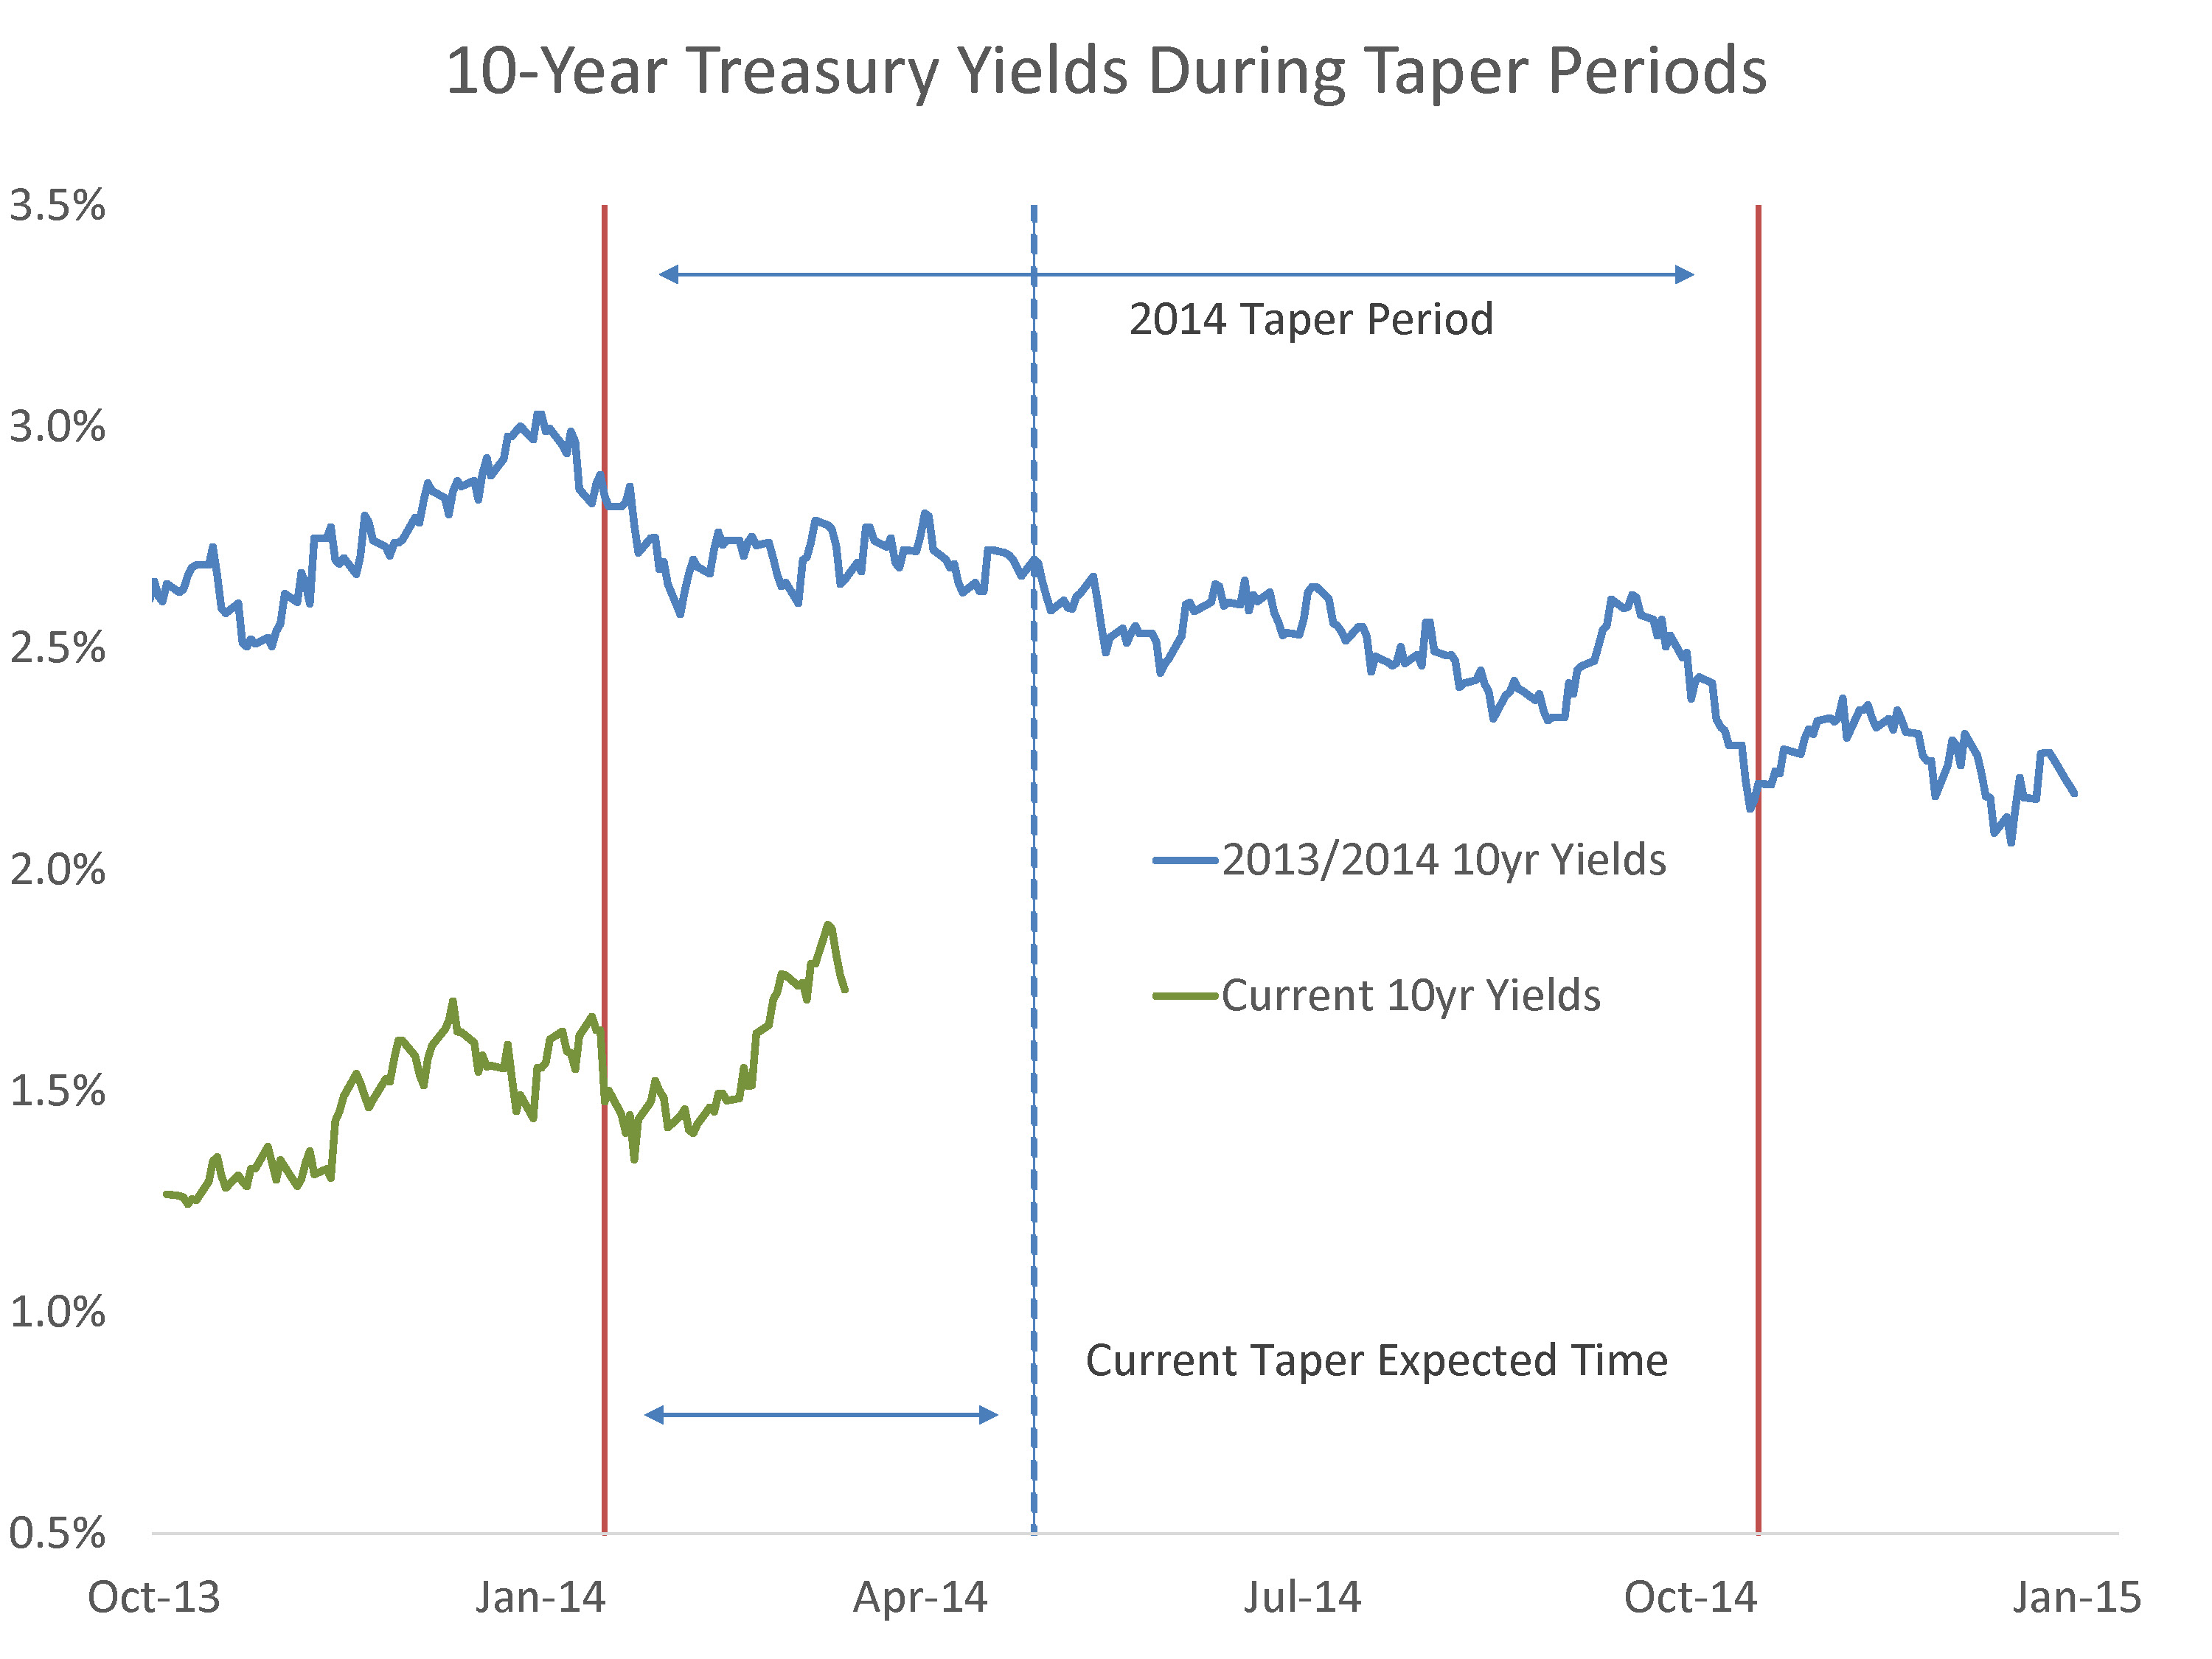
For bond investors, the good news is that much of the next two years is now priced into the yield curve, and with expectations of a 2% terminal rate there is less upside risk in rates over the coming quarters.
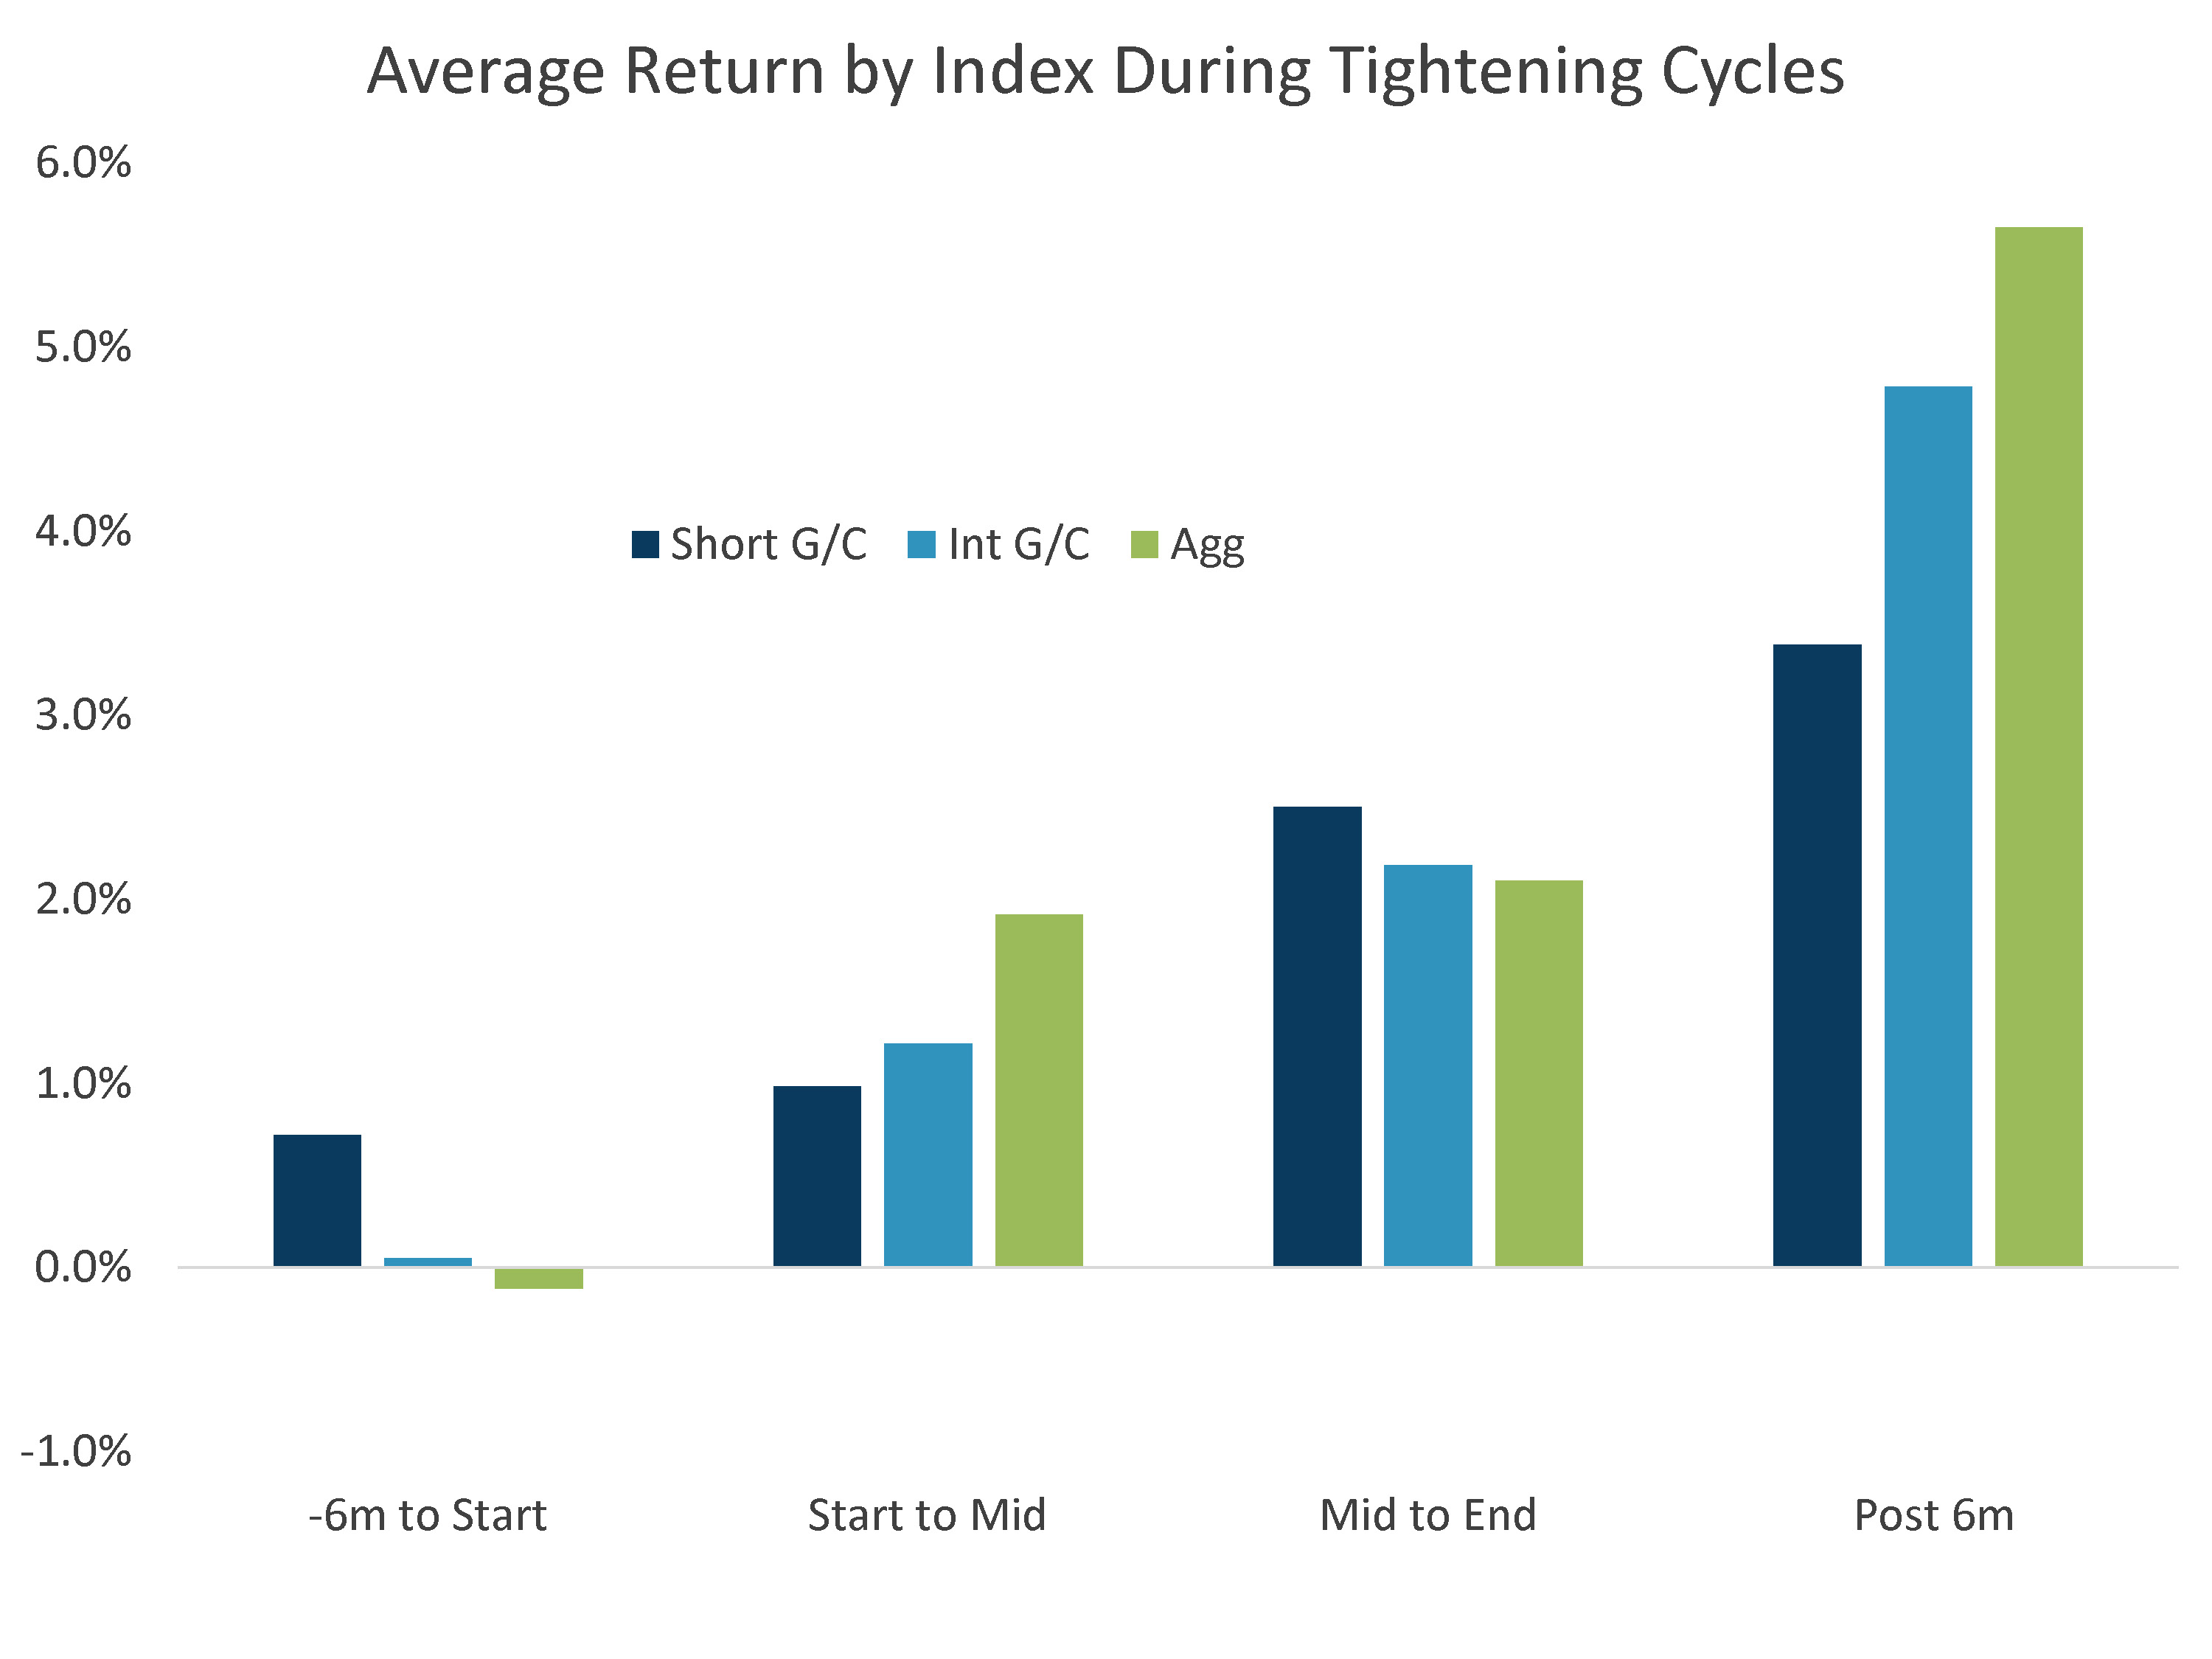
Historically, core bond returns have shown that most of the damage is done early. The curve typically flattens to zero and the rise in long-end rates is done by mid-cycle. Historical returns also highlight a consistent post-cycle rally.
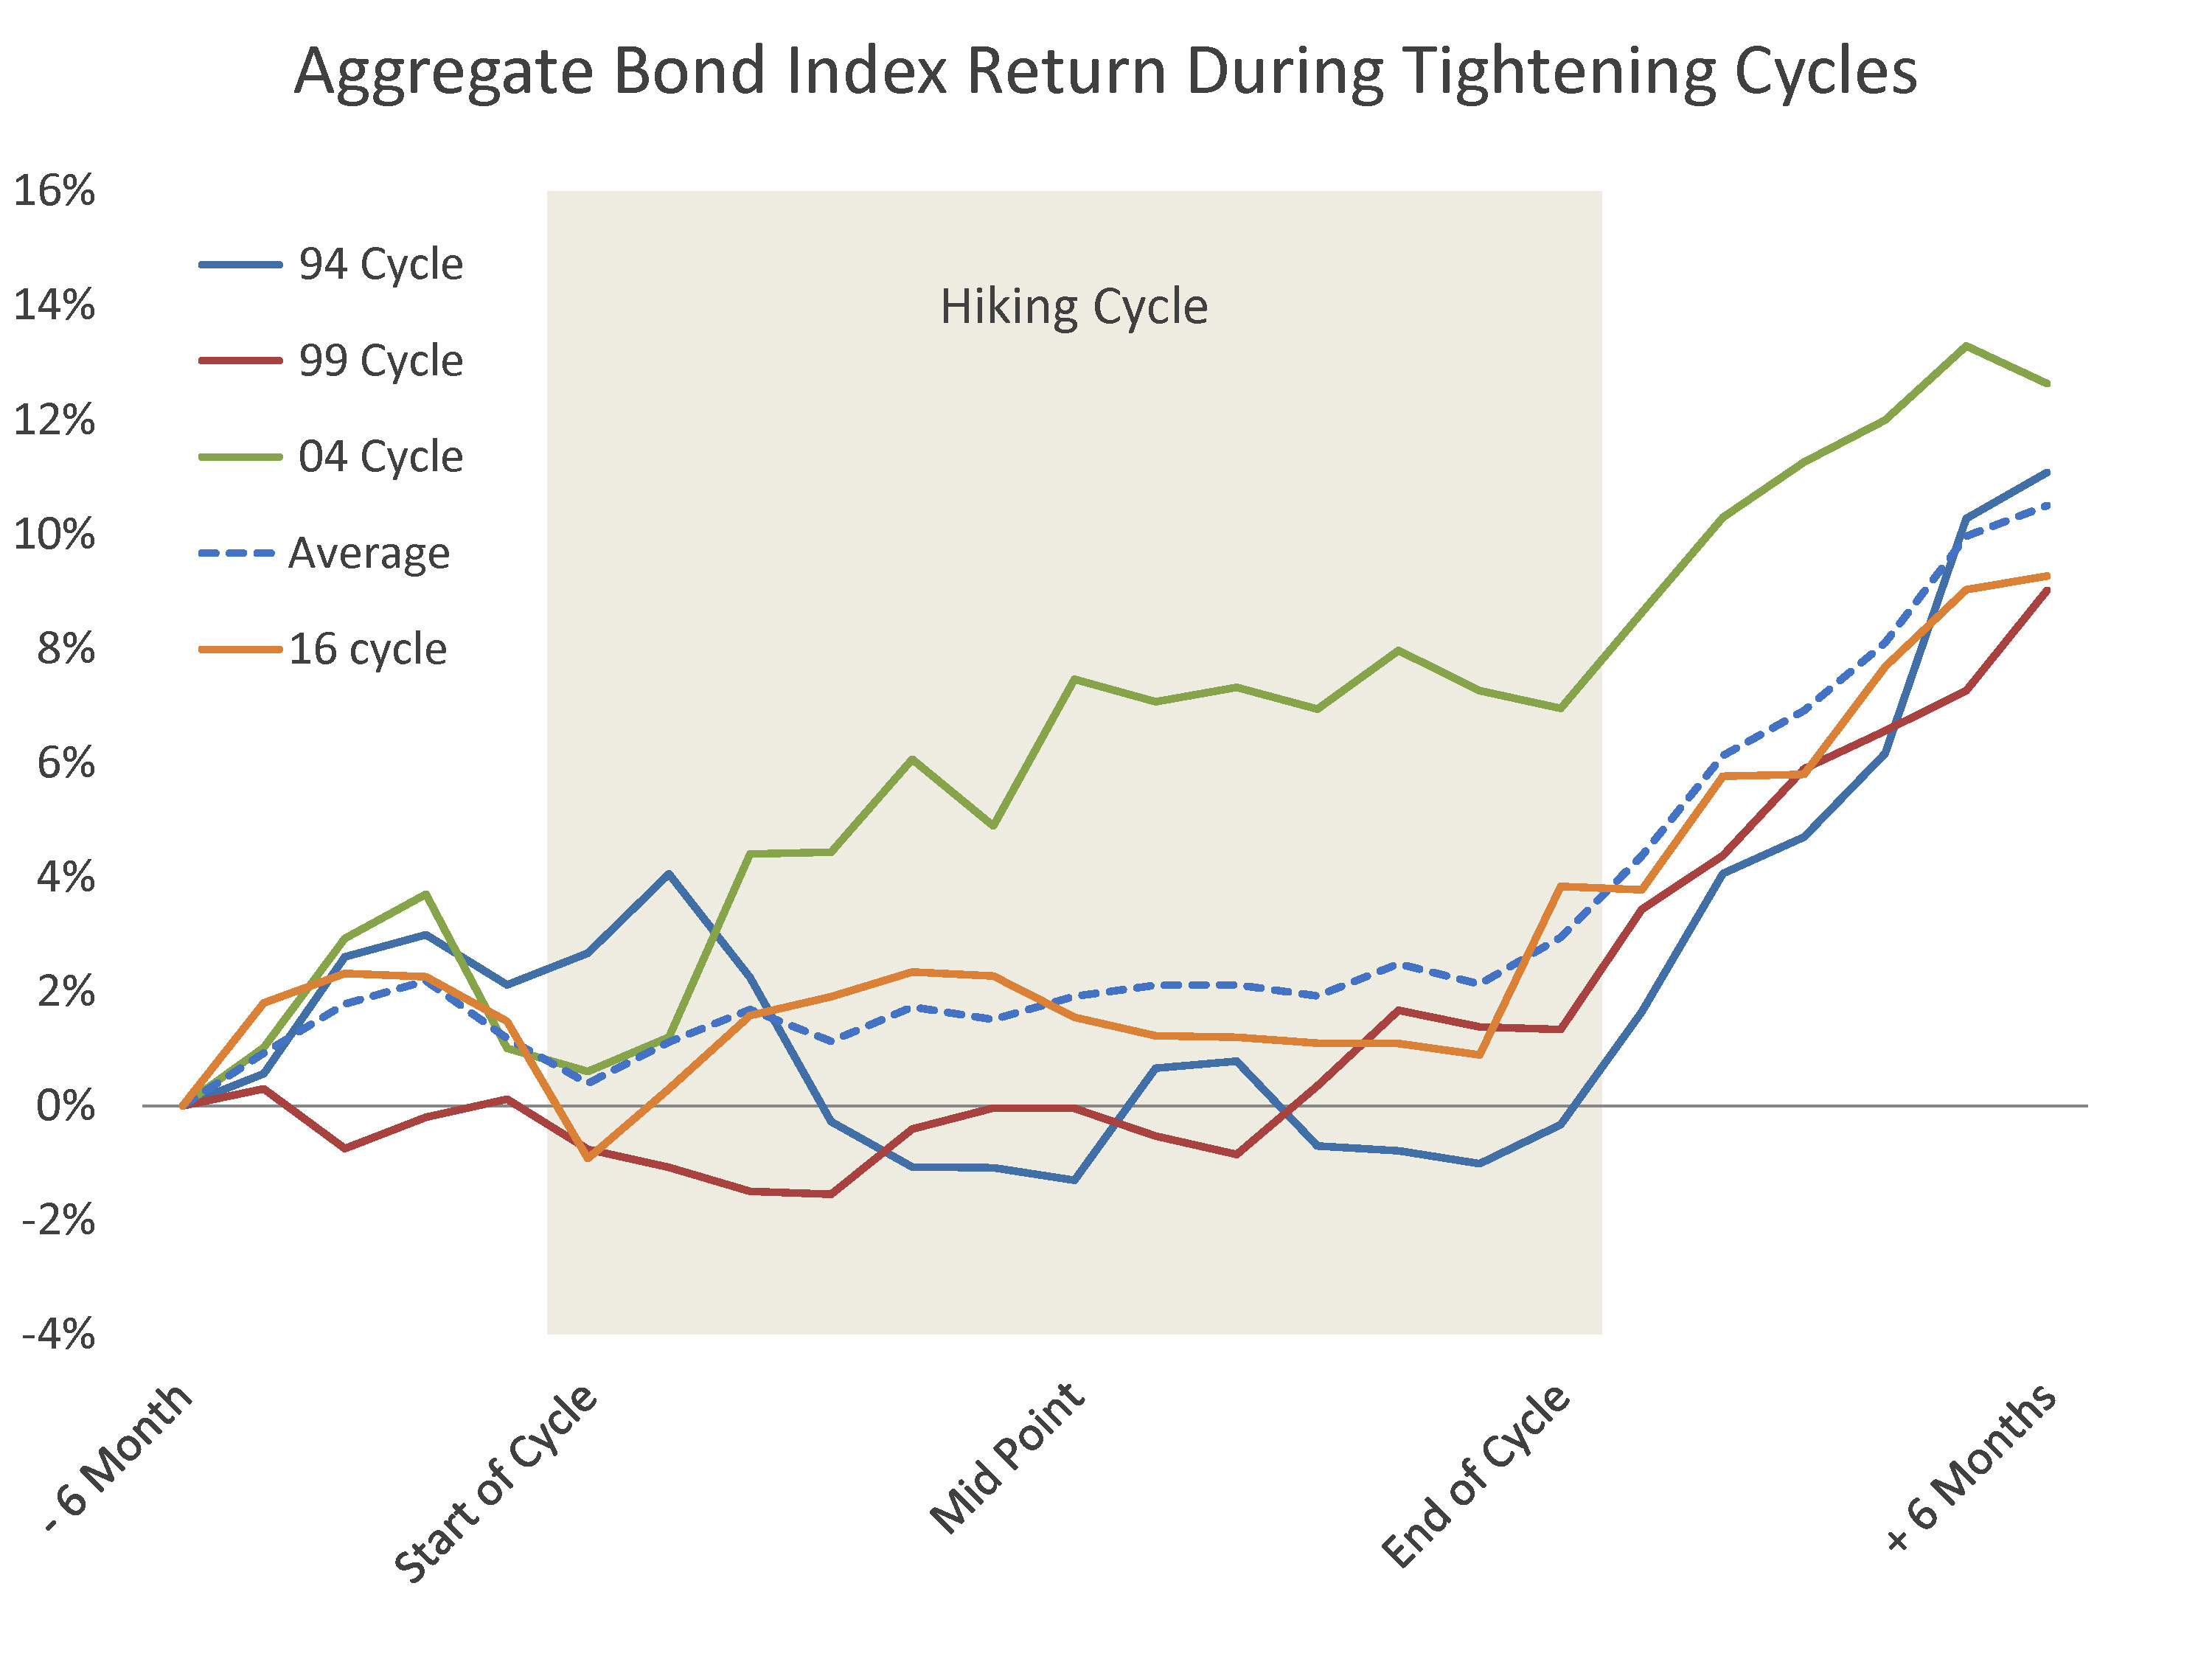
In terms of strategies, for investors most sensitive to negative returns, a shorter strategy outperforms leading into and during the early cycle. By mid-cycle it has made sense to push out duration to position for a post-cycle rally. The intermediate strategy, especially with an actively managed duration, has provided limited downside and captures much of the post-cycle return opportunities.
For more news, information, and strategy, visit the ETF Strategist Channel.
Source on all charts is Sage, Bloomberg.
Disclosures: This is for informational purposes only and is not intended as investment advice or an offer or solicitation with respect to the purchase or sale of any security, strategy or investment product. Although the statements of fact, information, charts, analysis and data in this report have been obtained from, and are based upon, sources Sage believes to be reliable, we do not guarantee their accuracy, and the underlying information, data, figures and publicly available information has not been verified or audited for accuracy or completeness by Sage. Additionally, we do not represent that the information, data, analysis and charts are accurate or complete, and as such should not be relied upon as such. All results included in this report constitute Sage’s opinions as of the date of this report and are subject to change without notice due to various factors, such as market conditions. Investors should make their own decisions on investment strategies based on their specific investment objectives and financial circumstances. All investments contain risk and may lose value. Past performance is not a guarantee of future results.
Sage Advisory Services, Ltd. Co. is a registered investment adviser that provides investment management services for a variety of institutions and high net worth individuals. For additional information on Sage and its investment management services, please view our web site at www.sageadvisory.com, or refer to our Form ADV, which is available upon request by calling 512.327.5530.
