
By Kevin Nicholson, CFA, Global Fixed Income CIO | Co-head of Investment Committee
SUMMARY
- Fixed Income – More of a Treat than a Trick for Yield Seeking Investors, in our view.
- We expect a shift from equities to fixed income with yields above 4% for income investors.
- 4% or higher risk-free rates align with many financial plan distribution rates.
It is Halloween, a time when we dress up in costumes and lose ourselves in whatever character we have chosen as our alter ego for the day. For some observers this is a time to trick others into thinking they will be rewarded for their efforts, and for others it is a time to reap the benefits of their efforts with treats. In our view, Halloween 2022 is shaping up to be a good time to evaluate whether the bond market is going to ‘trick’ investors into believing that prices will stop falling and that the ‘treat’ of sustainable higher income has finally arrived.
‘The Lost Decade’ – Not Just a Stock Phenomenon
It has been commonplace to speak of the ‘lost decade’ for stocks, the period from December 31, 1999, to December 31, 2009, when the total return of the S&P 500 was down 9.08%. While bonds have not suffered the same fate from a return perspective, the asset class has been de-emphasized in asset allocations for a decade as the 10-year Treasury fell from 3.8% in 2009 to a low of 0.5% in 2020. Low rates resulted from Quantitative Easing (QE) by the Fed, where large amounts of bonds were purchased to drive down yields and encourage investors to take risk again after the Great Financial Crisis (GFC). This process created asset inflation, sending home values and stocks soaring as investors’ cash looked for a home. QE did its job from an economic perspective, but as bonds appreciated yields fell. Bonds no longer gave investors adequate income, thus driving millions of investors to take on more risk through equities to fill the income void. We believe that may all be changing.
Bonds Offer Fixed Income Opportunity to Lock in More Attractive Distributions
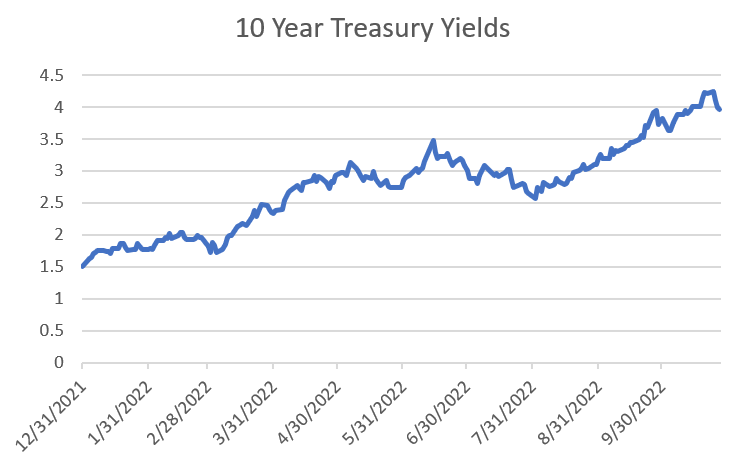
Source: Bloomberg Generic Price (BGN). Data daily, as of 10.27.2022. Shown for illustrative purposes only. Past Performance is no guarantee of future results.
With yields of short and long maturity bonds yielding near 4% or better, starting with 3-month T-Bills, we believe there could be a large asset shift from stocks to bonds in the coming years. Many financial planners model a 4% annual distribution rate in their financial plans to address clients’ spending needs in retirement. Since the GFC, those distributions have relied predominately on the total return of stocks rather than from bonds, as stocks have returned an annualized 13.66% versus 2.25% for bonds. The disparity in returns between stocks and bonds forced investors to take on more stock exposure than typically expected in a 60/40 portfolio. However, over the last year Treasury yields have risen dramatically, as indicated in the chart to the right, of the 10-year Treasury. While this has been devastating to bond returns over the last year– marking the trailing 12 months as one of the worst for government bonds in US history – this acute weakness has sown the seeds for a brighter future for bonds going forward, in our opinion.
Historically, as investors approached retirement age their allocation to bonds increased, reflecting their lower risk tolerance. However, for more than a decade that has not necessarily been the case. In 2019, 54.1 million Americans ages 65 and older, who if they can receive a risk-free 4% return in government bonds, or even higher yields in high quality corporate bonds are less likely to want to take added risk from stock ownership, in our opinion. Rather, we think investors will want to protect their sizable stock gains over the last decade by swapping from stocks into bonds.
The Options for Fixed Income
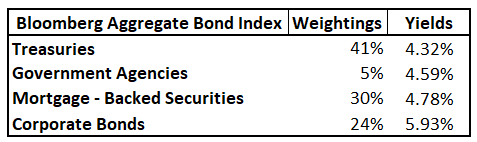
Source: Bloomberg; Data as of 10.28.2022. Shown for illustrative purposes only. Past Performance is no guarantee of future results.
As of October 28, 2022, the S&P 500 dividend yield is 1.70% and the Bloomberg Aggregate bond Index yields 4.94%, which is a significant spread. This is a significant increase from a year ago when the index yielded a mere 1.66% and the dividend yield on the S&P 500 at the time was 1.29%. The Bloomberg Aggregate index, a widely followed index meant to track the overall performance of the US investment-grade bond market, is comprised of Treasuries, agencies, mortgage-backed securities, corporate bonds, and asset backed securities. By incorporating more than just Treasuries in a portfolio, investors can get a higher yield if they are willing to take on some incremental risk. The full breakdown of the Bloomberg Aggregate index is shown to the left.
Conclusion:
We believe bonds are finally offering investors attractive yields, especially when compared to the dividend yield on stocks. Hence, we see the value of adding bonds back to portfolios for investors needing income. While we understand that the Fed is not done with its rate hiking cycle, we believe that it is closer to the end than the beginning. Furthermore, we believe that bond prices have already anticipated some further rate increases by the Fed. For all the reasons discussed in this piece, we are opportunistically looking to add fixed income to the balanced portfolios. Thus, we believe that bonds yields are a treat for investors that have been getting tricked for the past decade or more.
Risk Discussion: All investments in securities, including the strategies discussed above, include a risk of loss of principal (invested amount) and any profits that have not been realized. Markets fluctuate substantially over time, and have experienced increased volatility in recent years due to global and domestic economic events. Performance of any investment is not guaranteed. In a rising interest rate environment, the value of fixed-income securities generally declines. Diversification does not guarantee a profit or protect against a loss. Investments in international and emerging markets securities include exposure to risks such as currency fluctuations, foreign taxes and regulations, and the potential for illiquid markets and political instability. Please see the end of this publication for more disclosures.
Important Disclosure Information:
The comments above refer generally to financial markets and not RiverFront portfolios or any related performance. Opinions expressed are current as of the date shown and are subject to change. Past performance is not indicative of future results and diversification does not ensure a profit or protect against loss. All investments carry some level of risk, including loss of principal. An investment cannot be made directly in an index.
Information or data shown or used in this material was received from sources believed to be reliable, but accuracy is not guaranteed.
This report does not provide recipients with information or advice that is sufficient on which to base an investment decision. This report does not take into account the specific investment objectives, financial situation or need of any particular client and may not be suitable for all types of investors. Recipients should consider the contents of this report as a single factor in making an investment decision. Additional fundamental and other analyses would be required to make an investment decision about any individual security identified in this report.
Chartered Financial Analyst is a professional designation given by the CFA Institute (formerly AIMR) that measures the competence and integrity of financial analysts. Candidates are required to pass three levels of exams covering areas such as accounting, economics, ethics, money management and security analysis. Four years of investment/financial career experience are required before one can become a CFA charterholder. Enrollees in the program must hold a bachelor’s degree.
All charts shown for illustrative purposes only. Technical analysis is based on the study of historical price movements and past trend patterns. There are no assurances that movements or trends can or will be duplicated in the future.
Stocks represent partial ownership of a corporation. If the corporation does well, its value increases, and investors share in the appreciation. However, if it goes bankrupt, or performs poorly, investors can lose their entire initial investment (i.e., the stock price can go to zero). Bonds represent a loan made by an investor to a corporation or government. As such, the investor gets a guaranteed interest rate for a specific period of time and expects to get their original investment back at the end of that time period, along with the interest earned. Investment risk is repayment of the principal (amount invested). In the event of a bankruptcy or other corporate disruption, bonds are senior to stocks. Investors should be aware of these differences prior to investing.
Index Definitions:
Standard & Poor’s (S&P) 500 Index measures the performance of 500 large cap stocks, which together represent about 80% of the total US equities market.
Bloomberg US Aggregate Bond Index TR USD (Fixed Income Investment Grade) is an unmanaged index that covers the investment grade fixed rate bond market with index components for government and corporate securities, mortgage pass-through securities and asset-backed securities. The issues must be rated investment grade, be publicly traded and meet certain maturity and issue size requirements.
Mortgage Backed Securities (MBS) are bonds secured by home and other real estate loans. Mortgage-backed securities are subject to prepayment and extension risk ; as such, they react differently to changes in interest rates than other bonds. Small movements in interest rates may quickly and significantly reduce the value of certain mortgage backed securities.
Treasuries are government debt securities issued by the US Government. Treasury securities typically pay less interest than other securities in exchange for lower default or credit risk. With relatively low yields, income produced by Treasuries may be lower than the rate of inflation.
‘Risk-Free’ rate is the theoretical rate of return of an investment with zero risk, which we define by using the 10-yr US Treasury Yield.
In general, the bond market is volatile, and fixed income securities carry interest rate risk. (As interest rates rise, bond prices usually fall, and vice versa). This effect is usually more pronounced for longer-term securities). Fixed income securities also carry inflation risk, liquidity risk, call risk and credit and default risks for both issuers and counterparties. Lower-quality fixed income securities involve greater risk of default or price changes due to potential changes in the credit quality of the issuer. Foreign investments involve greater risks than U.S. investments, and can decline significantly in response to adverse issuer, political, regulatory, market, and economic risks. Any fixed-income security sold or redeemed prior to maturity may be subject to loss.
RiverFront Investment Group, LLC (“RiverFront”), is a registered investment adviser with the Securities and Exchange Commission. Registration as an investment adviser does not imply any level of skill or expertise. Any discussion of specific securities is provided for informational purposes only and should not be deemed as investment advice or a recommendation to buy or sell any individual security mentioned. RiverFront is affiliated with Robert W. Baird & Co. Incorporated (“Baird”), member FINRA/SIPC, from its minority ownership interest in RiverFront. RiverFront is owned primarily by its employees through RiverFront Investment Holding Group, LLC, the holding company for RiverFront. Baird Financial Corporation (BFC) is a minority owner of RiverFront Investment Holding Group, LLC and therefore an indirect owner of RiverFront. BFC is the parent company of Robert W. Baird & Co. Incorporated, a registered broker/dealer and investment adviser.
To review other risks and more information about RiverFront, please visit the website at www.riverfrontig.com and the Form ADV, Part 2A. Copyright ©2022 RiverFront Investment Group. All Rights Reserved. ID 2565484
