

By Timothy D. Calkins, CFA
The third quarter of 2023 was back loaded with volatility. The S&P 500 had traded sideways from July through mid-September, even as the Treasury yield curve continued to move higher, increasing borrowing costs for consumers and businesses. The yield on the 10-year Treasury bond had risen around 50 basis points prior to the Federal Reserve meeting that concluded on September 20th. That day, the Fed released their Summary of Economic Projections, which includes what is known as the “Dot Plot” chart. This chart is released quarterly, and illustrates the expectations of future Federal Funds interest rate levels, as estimated by the members of the rate-setting Federal Open Market Committee (FOMC).
The Dot Plot released on September 20th revealed a much more pronounced “Higher for Longer” expectation from the Fed, with the terminal rate above prior levels, and the Fed Funds rate declining more gradually than in prior expectations released.
Fed has convinced the market of Higher for Longer
Pushing 2024 dot plot 100 bps higher YTD
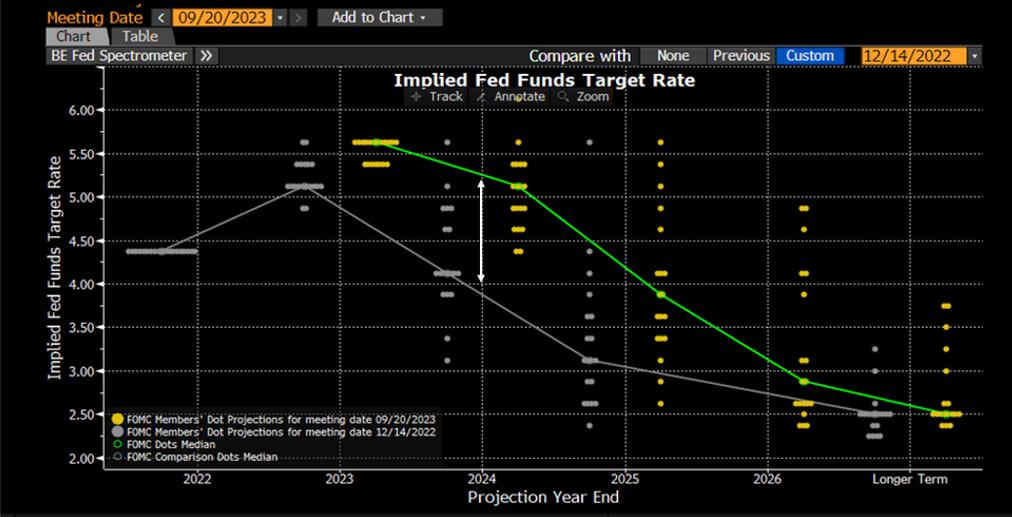
Source: Bloomberg Finance L.P.
This shock pushed the 10-year Treasury bond higher by an additional 20 basis points to end Q3, and caused the S&P 500 to go from a roughly flat return in the quarter to ending over 3% in the red, with the Mid-Cap and Small-Cap indices down slightly more. International equity (EAFE), and emerging markets (EM), posted similar declines.
The negative momentum created by the Dot Plot chart release did not end just because the quarter came to a close. Interest rates continued to trend higher and equity markets lower through October.
S&P 500 vs. U.S. 10YR Yield
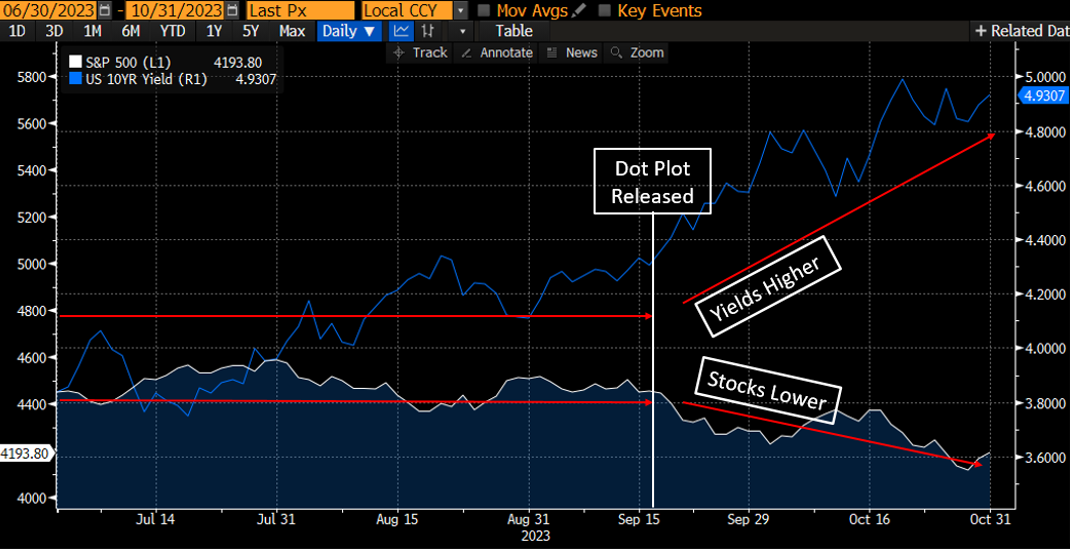
Source: Bloomberg Finance L.P.
Global central banks continue to find themselves preoccupied by their battle with inflation. The Federal Reserve has made significant progress, as has the European Central Bank (ECB). Both institutions saw inflation approach or breach double digits, spurring them to take aggressive actions intended to bring inflation back down to their target levels of roughly 2%. Both the US and the EU have seen significant success in reducing inflation readings.
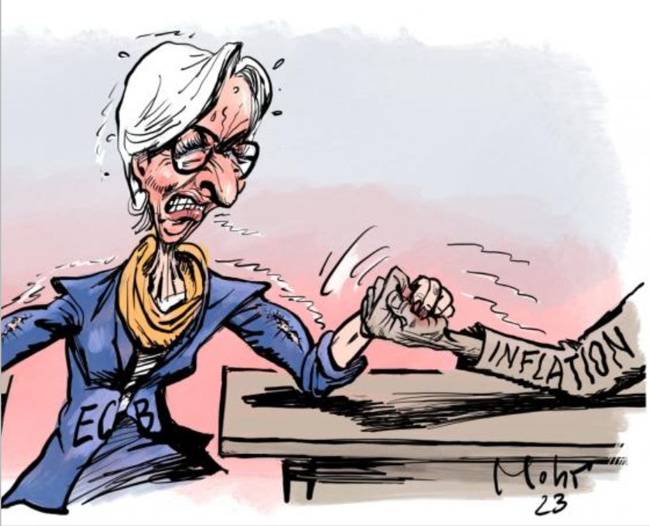
Lagarde’s Battle with Inflation
Christine Lagarde, President of the European Central Bank (ECB), recently stated, “We are determined to bring inflation down to 2%…According to our projections we will get there in 2025.” Jerome Powell, Chairperson of the Federal Reserve, has also expressed strong resolve in the fight against inflation, vowing to keep interest rates elevated until this goal is achieved.
Inflation Declining in U.S. and Europe
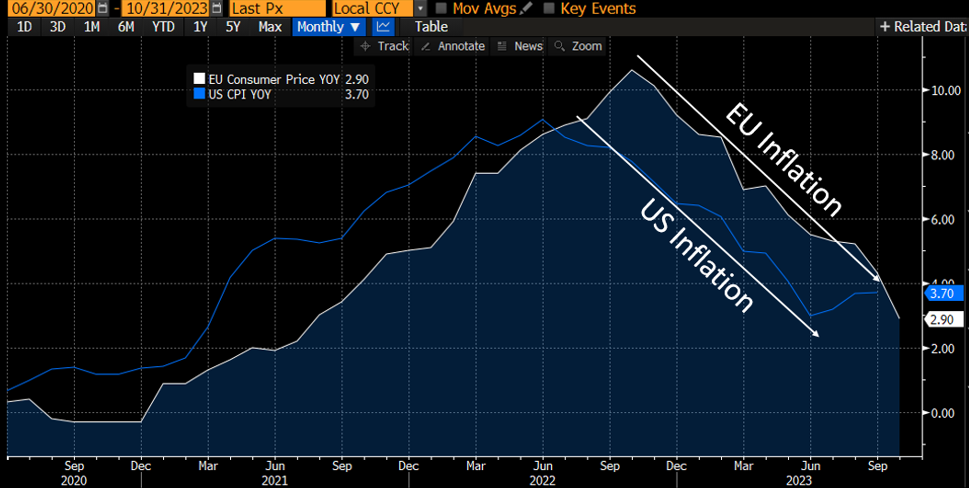
Source: Bloomberg Finance L.P.
The declining levels of inflation are a victory for consumers who have been pinched by rising prices, and so far, this victory seems to have been costless in terms of the economic pain that is often required to moderate inflation. To this point, neither the U.S. nor the Eurozone have experienced a signifcant rise in unemployment.
Little Effect on Employment
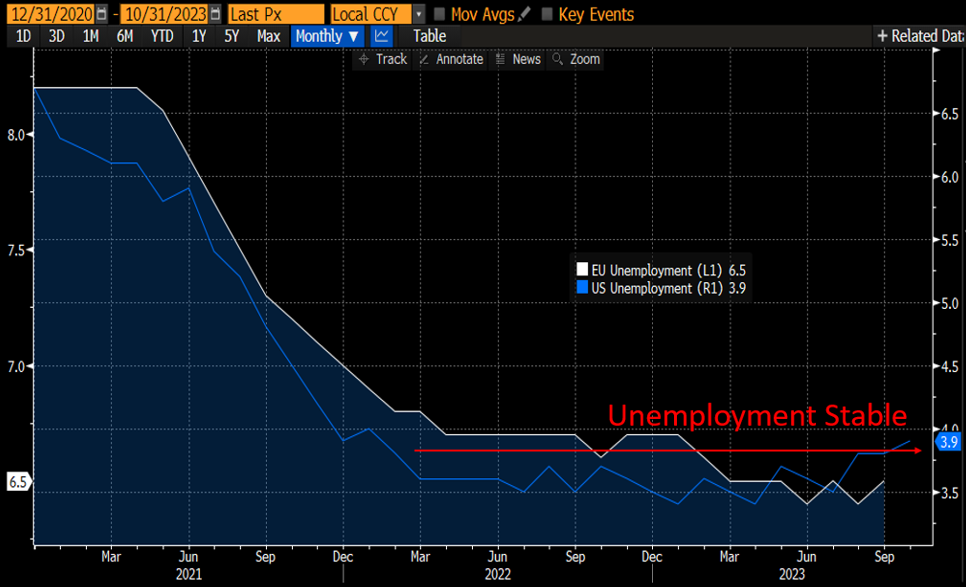
Source: Bloomberg Finance L.P.
Risks Building in Europe
The same cannot be said for European economic activity. While the United States economy has continued to expand and even accelerate, fueled by an extremely strong consumer (thus far), the European economy has stagnated, and appears to be approaching stall speed.
Tighter Policy and Geopolitics Hurting Growth in Europe
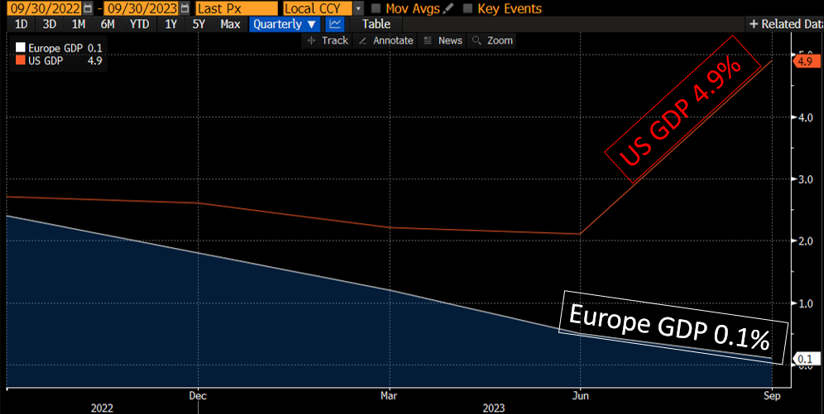
Source: Bloomberg Finance L.P.
European economic concerns are being reflected in the corporate bond market. CCC rated bonds offer very high yields due to their elevated leverage and potential for default. This additional yield spread above credit risk-free government bond yields had been fairly consistent between European and U.S. companies. Recently, as European economic growth began to falter, the additional yield that investors require to invest in European CCC bonds has diverged, moving significantly higher than what is required by investors in U.S. bonds of equal credit quality. This can be interpreted as a reflection of the rising default risk created by Europe’s abysmal economic growth, teetering on the brink of recession.
Risky European Companies Pay Highest Borrowing Premium Since 2006
Index Spreads (Percentage Points)
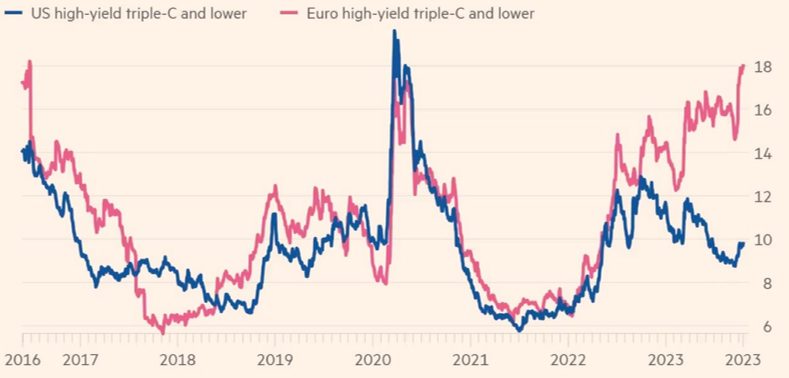
Ice BofA indices: CCC & Lower Euro High Yield Index versus CCC & Lower US High Yield Index (option-adjusted spreads) Source: Ice Data Services; © FT
The risk of owning low quality bonds has risen in the U.S., illustrated by the rising defaults and falling recovery rates noted in the chart below. Typically, these outcomes would push credit spreads wider as investors demand higher yields to compensate for these growing risks. The market has bucked that historic trend, and instead has begun offering less compensation (tighter spreads) on higher risk bonds. This divergence should reconcile itself in time, with defaults rates declining, or yield spreads rising, which could create a compelling opportunity.
U.S. High Yield Bonds
Default rate and spread-to-worst (%)
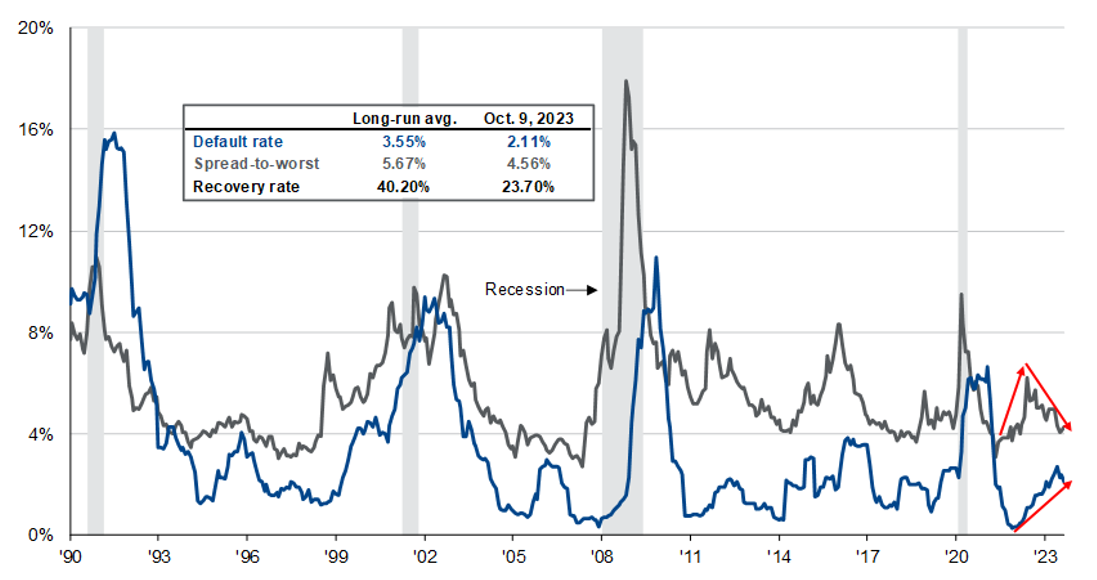
Source: J.P. Morgan Global Economic Research, J.P. Morgan Asset Management. Long-run average is based on monthly historical data beginning in January 1990. Default rates are defined as the par value percentage of the total market trading at or below 50% of par value and include any Chapter 11 filing, prepackaged filing or missed interest payments. The default rate is an LTM figure (last 12 months) and tracks the % of defaults over the period. Recovery rates are based on the price of the defaulted bonds or loans 30 days post the default date. Default and recovery rates are as of most recent month-end. Spread-to-worst indicated are the difference between the yield-to-worst of a bond and yield-to-worst of a U.S. Treasury security with a similar duration. High yield is represented by the J.P. Morgan Domestic High Yield Index. Guide to the Markets – U.S. Data are as of October 9, 2023.
In the higher quality portion of the bond market, some historically appealing valuations have begun to present themselves. Treasury Inflation-Protected Securities (TIPS) are Treasury bonds that offer investors a return that rises along with inflation. This “real yield,” has recently offered a return of 2%+ above the rate of inflation. Today’s real yields are among the highest that we have seen in the past 20 years, and at a time when future inflation is perhaps the least predictable that it has been in that same time period. The inflation hedge component of TIPS appears to be very reasonably priced.
Opportunity to hedge inflation at historically attractive level, while potential for inflation
volatility remains high
10-yr TIPS yield
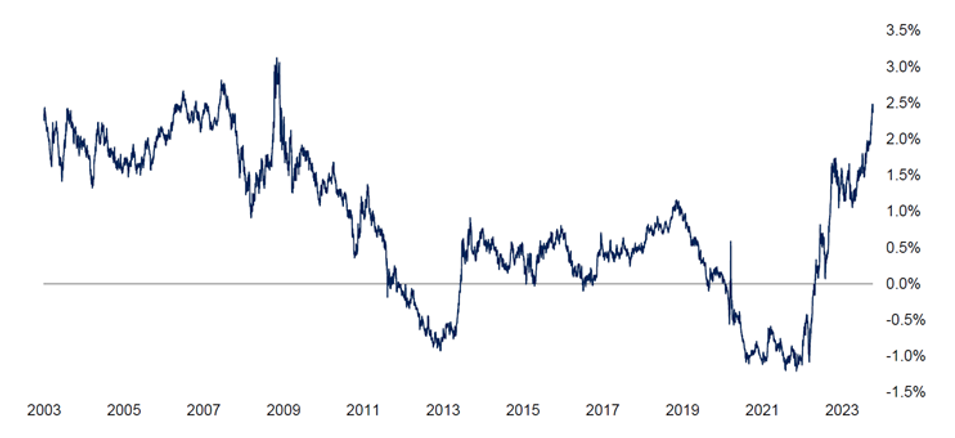
Source: FHN Financial; Bloomberg
The broad increase in yields has made much of fixed income very attractive. Interest rates have risen so much that a portfolio of bonds provides some self-insurance against future price declines. This insurance is provided by the cash-flow generated by the higher coupon payments that it is now possible to receive. Without going too deep into the bond math, the chart below illustrates how current bond exposures would hold up to another 100 basis point increase in interest rates.
Fixed Income Market Dynamics
Impact of a 1% rise or fall in interest rates – Total return, assumes a parallel shift in the yield curve
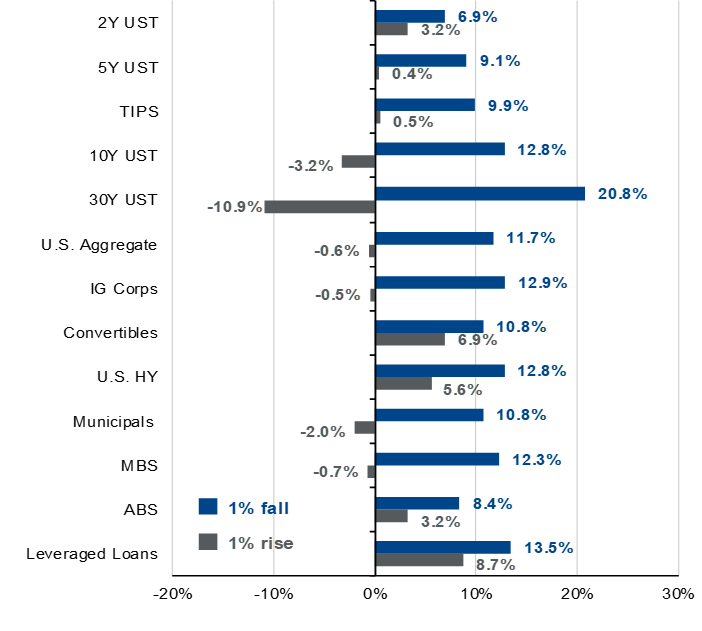
Source: Bloomberg, FactSet, Standard & Poor’s, U.S. Treasury, J.P. Morgan Asset Management. Sectors shown above are provided by Bloomberg unless otherwise noted and are represented by – U.S. Aggregate; MBS: U.S. Aggregate Securitized – MBS; ABS: J.P. Morgan ABS Index; Corporates: U.S. Corporates; Municipals: Muni Bond; High Yield: Corporate High Yield; Leveraged Loans: J.P. Morgan Leveraged Loan Index; TIPS: Treasury Inflation-Protected Securities; Convertibles: U.S. Convertibles Composite. Convertibles yield is as of most recent month-end and is based on U.S. portion of Bloomberg Global Convertibles Index. Yield and return information based on bellwethers for Treasury securities. Sector yields reflect yield-to-worst. Convertibles yield is based on U.S. portion of Bloomberg Global Convertibles. Correlations are based on 15-years of monthly returns for all sectors. Past performance is not indicative of future results.
While returns would be dampened by rates moving up further, only the longest maturity exposure (30 Year Treasury) would face a significantly negative 12-month return. Many of the exposures would be near breakeven or even produce significantly positive 12-month returns in the face of rising rates. This illustrates the new found strength within the fixed income markets. The income is back, and doing its job protecting capital. Now is a great time to be putting money to work in the bond market, and locking in the income producing opportunities that have presented themselves over the past 18 months.
We are happy to discuss these opportunities and the markets more deeply. Please reach out with any questions.
Timothy D. Calkins, CFA
Co-Chief Investment Officer
November 2023
Nottingham Advisors, LLC (“Nottingham”) is an SEC registered investment adviser located in Amherst, New York. Registration does not imply a certain level of skill or training. Nottingham and its representatives are in compliance with the current registration and notice filing requirements imposed upon SEC registered investment advisers by those states in which Nottingham maintains clients. Nottingham may only transact business in those states in which it is registered, notice filed, or qualifies for an exemption or exclusion from registration or notice filing requirements. For information pertaining to the registration status of Nottingham, please contact Nottingham or refer to the Investment Advisor Public Disclosure Website (www.adviserinfo.sec.gov). Any subsequent, direct communication by Nottingham with a prospective client shall be conducted by a representative that is either registered or qualifies for an exemption or exclusion from registration in the state where the prospective client resides.
This newsletter is limited to the dissemination of general information pertaining to Nottingham’s investment advisory services. As such nothing herein should be construed as the provision of personalized investment advice. The information contained herein is based upon certain assumptions, theories and principles that do not completely or accurately reflect your specific circumstances. Information presented herein is subject to change without notice and should not be considered as a solicitation to buy or sell any security. Adhering to the assumptions, theories and principles serving the basis for the information contained herein should not be interpreted to provide a guarantee of future performance or a guarantee of achieving overall financial objectives. As investment returns, inflation, taxes and other economic conditions vary, your actual results may vary significantly. Furthermore, this newsletter contains certain forward-looking statements that indicate future possibilities. Due to known and unknown risks, other uncertainties and factors, actual results may differ materially from the expectations portrayed in such forward-looking statements. Readers are cautioned not to place undue reliance on forward-looking statements, which speak only as of their dates. As such, there is no guarantee that the views and opinions expressed in this article will come to pass. This newsletter should not be construed to limit or otherwise restrict Nottingham’s investment decisions.
This newsletter contains information derived from third party sources. Although we believe these third party sources to be reliable, we make no representations as to the accuracy or completeness of any information prepared by any unaffiliated third party incorporated herein, and take no responsibility therefore. Some portions of this newsletter include the use of charts or graphs. These are intended as visual aids only, and in no way should any client or prospective client interpret these visual aids as a method by which investment decisions should be made. We have provided performance results of certain market indices for illustrative purposes only as it is not possible to directly invest in an index. Indices are unmanaged, hypothetical vehicles that serve as market indicators and do not account for the deduction of management fees or transaction costs generally associated with investable products, which otherwise have the effect of reducing the performance of an actual investment portfolio. It should not be assumed that your account performance or the volatility of any securities held in your account will correspond directly to any benchmark index. A description of each index is available from us upon request.
Investing in the stock market involves gains and losses and may not be suitable for all investors. Past performance is no guarantee of future results.
For additional information about Nottingham, including fees and services, send for our Disclosure Brochure, Part 2A or Wrap Brochure, Part 2A Appendix 1 of our Form ADV using the contact information herein.
For more news, information, and analysis, visit the ETF Strategist Channel.