

By Adam Grossman, CFA
SUMMARY
- When it comes to earnings, we believe Estimates Matter, Surprises Matter, and Trends Matter.
- 2nd Quarter earnings were better than expected.
- Estimates for Q3 and beyond have also improved, which supports our bullish positioning.
RiverFront’s Three Principles for Separating News from Noise
Earnings are instrumental in measuring a companies’ health and profitability. Quarterly earnings reports provide investors with crucial insight into whether a company is delivering value to its shareholders. And right now, diverging views on earnings are what separates the ‘bulls’ from the ‘bears’.
Our Earnings Analysis Framework: Before we can interpret S&P500 earnings or an individual company’s earnings, we first need to establish a framework for such an analysis. Specifically, at RiverFront, there are 3 basic principles that guide our analysis of earnings:
1. Estimates Matter: Analysts’ expectations matter because they can represent “the wisdom of the crowds”. While these forecasts are not perfect – or even always directionally correct – we believe there is wisdom in understanding the range of opinions, and the variables affecting those forecasts.
- How we apply it: While we try to think beyond analysts’ consensus earnings estimates, we like to use these estimates as a starting point from which to challenge our own assumptions. We can use our views in comparison to consensus to gain a sharper opinion of a stock’s intrinsic value. It’s a way to leverage “the Wisdom of the Crowd,” without fully joining the crowd.
2. Surprises Matter: Surprises can move markets, whether those surprises are a major difference in current earnings vs. expectations, or in management’s forward guidance.
- How we apply it: Like the market, we are often surprised by an earnings report or a press conference. World-class portfolio management teams aspire to be right 60% of the time, which means being wrong 40% of the time. Instead of beating ourselves up for a missed forecast, we move quickly to incorporate how these surprises have changed our investment thesis and views on intrinsic value.
3. Trends Matter: Historic growth is critical as a “track record” of success in growing earnings. There is evidence of earnings having ‘momentum’, where companies find ways to maximize their competitive advantage, and then exploit it over subsequent quarters.
- How we apply it: We also understand that one bad quarter or press conference is not the ‘be-all and end-all’ for a company. Instead, we digest each earnings report within the context of a long-term track record and the macro conditions a company is facing. Taking this long-term view helps give us perspective.
Q2 Earnings Recap For S&P 500: Earnings Growth Better than Expected.
Using the framework we established above, let’s apply our 3 principles to the 2nd quarter results for the aggregate S&P 500.
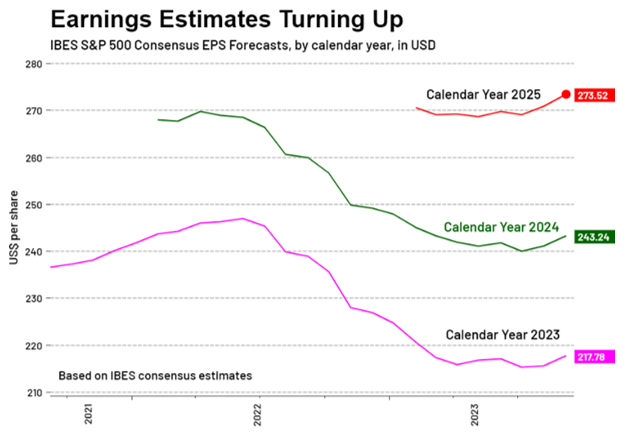
Source: LSEG Datastream, RiverFront. Data weekly as of September 8, 2023. Chart shown for illustrative purposes.
- Estimates Matter: Analysts’ expectations have been steadily increasing for both the second quarter and the next couple of years. This can be seen in the chart on the right. The lines represent analysts’ aggregate earnings forecasts for the calendar years 2023, 2024, and 2025. As you can see, each line has started trending upward. We believe this increase can be viewed as the market beginning to believe in an economic ‘soft landing’. Companies appear to be handling higher rates and higher inflation better than expected. Importantly, earnings and commentary were good enough to cause analysts to revise earnings estimates for the S&P 500 up for this year, as well as 2024 and 2025
- Surprises Matter: Across all the sectors in the S&P 500, earnings surprises were positive on average. Consumer discretionary, technology and communication services experienced especially strong surprises, driven by AI-related increases to earnings estimates. However, with the Fed still concerned about the strength of the economy, the positive of strong earnings might portend further Fed rate hikes.
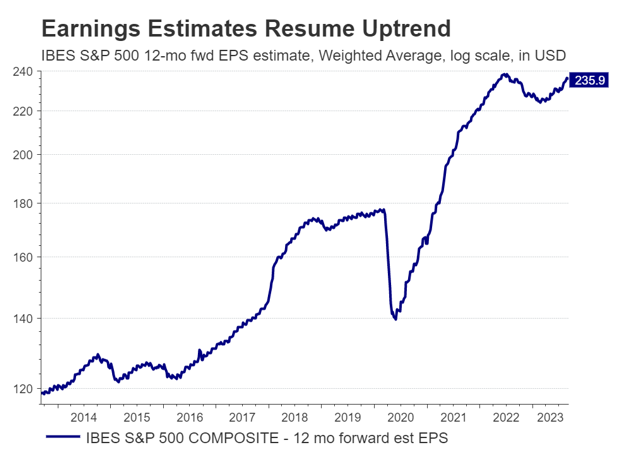
Source: LSEG Datastream, RiverFront. Data weekly as of September 8, 2023. Chart left shown for illustrative purposes.
- Trends Matter: S&P500 price action has stalled since June, which is not surprising given its large upward move year-to-date. What we think is important is that aggregate revenue has grown more than expected, what the chart to the left shows us is that, after a soft patch of deceleration in 2022, the S&P500 is now expected to resume its multi-year upward trend in earnings growth.
Taking these three principles together, and looking ahead to the third quarter, we believe earnings are painting a relatively constructive picture for U.S. stocks.
Conclusion: Constructive Earnings Trends Supports Our Preference for Stocks Over Bonds
The second quarter earnings season highlighted the importance of earning analysis, while demonstrating that this analysis cannot be performed in a vacuum. The macroeconomic context of higher interest rates and elevated inflation are key to understanding company stock performance, as much as the earnings that were delivered, and the guidance given. While earnings growth in the second quarter was somewhat concerning given elevated inflation costs, we were encouraged that companies were still able to surmount analysts’ expectations. Looking to the third quarter and beyond, we believe earnings reports will show continued resilience, with upside potential coming from further taming of inflation and leveling of interest rates.
From a portfolio perspective, we are currently favoring stocks over bonds, reflecting a cautious optimism. Digging deeper, we prefer sectors where growth is evident, such as mega-cap technology, and sectors with valuations that are less stretched, such as energy. As always, we stand ready to risk-manage should earnings or the economy take a turn for the worse.
News vs. Noise: Looking at a Single Company’s Earnings to Help Explain Our 3 Principles
An index like the S&P 500 is a collection of companies, and one of the things that creates a lot of confusion in the market is the number of ways analysts aggregate individual companies into index-level estimates. With hundreds of companies, there is also a mix of signals – some companies are performing well, and others less so. To dig into how we evaluate estimates, surprises, and trends a little more clearly, we are going to analyze an individual company’s earnings report. In this case, we chose to use the Q2 earnings of the world’s largest company– Apple Inc. – as an illustrative example.
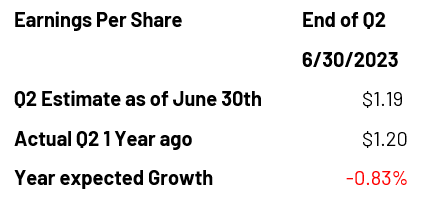
Apple traditionally reports in the middle of earnings season (August 3rd for the second quarter of 2023). However, let’s step back in time to the end of the earnings period. On June 30th, analyst expectations for Apple’s earnings release were for an Earnings per Share (EPS) result of $1.19 (see first table, below). Despite not having an actual earnings number for another 34 days, we can infer that Apple is expected to have hit the same “soft patch” that the overall of the S&P 500 did.
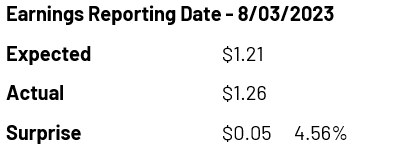
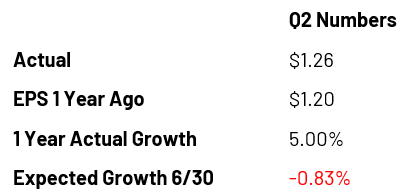
Now, August 3rd arrives, and Apple is set to report its earnings after market close. Ahead of the announcement, analysts raised their EPS estimate to $1.21, which is positive for Apple. Even better from an earnings standpoint, Apple reports an actual EPS of $1.26. At first glance, this is a good number, beating what analysts expected by 4.6% (see second table, below). This is what we refer to as a positive ‘earnings surprise’:
Comparing Actual growth over the last year is also critical to our ‘trends matter’ analysis, since earnings grew 5% over this tough period, versus the minor contraction that was expected at the end of the quarter (see third table, below):
However, there is still more information to digest; along with headline earnings, Apple will provide in-depth financial information and management comments (guidance). Additionally, externally, analysts will revise their estimates for subsequent quarters (earnings revisions). It is the totality of this information that the market will react to over the next couple of days.
In Apple’s case, while their earnings beat in Q2, non-core divisions (i.e., not the iPhone) drove those earnings surprises. Since the iPhone is viewed as the most important driver of long-term profit, the continued slowdown of iPhone sales led to investors reassessing their longer-term growth rate of earnings. Analysts increased near-term earnings based on the other segments’ strength, but that was not enough to overcome concerns about longer-term growth. With all of this being considered, Apple ended up down -4.8% the next day despite what, to a casual observer, seemed to be a good earnings report.
From the example of Apple, we can lean on our three earnings principles espoused earlier to provide context:
- Estimates Matter: In this earnings report, the crowd’s estimate was in the ballpark, but it underestimated non-core services income near term, and over-estimated iPhone sales and sales trends, in our view.
- Surprises Matter: In this case, we believe the guidance from the company overpowered the upside earnings surprise.
- Trends Matter: In this case, we believe iPhone segment sales created a perception of a negative track record in the earnings trend for Apple.
We would also point out that long-term fundamentals are critical to owning a stock… but we believe Apple’s most recent report is an example of how a company with strong fundamentals could experience a price setback, despite overall positive earnings results. Sometimes macro uncertainty and guidance can overwhelm the current results.
Risk Discussion: All investments in securities, including the strategies discussed above, include a risk of loss of principal (invested amount) and any profits that have not been realized. Markets fluctuate substantially over time and have experienced increased volatility in recent years due to global and domestic economic events. Performance of any investment is not guaranteed. In a rising interest rate environment, the value of fixed-income securities generally declines. Diversification does not guarantee a profit or protect against a loss. Investments in international and emerging markets securities include exposure to risks such as currency fluctuations, foreign taxes and regulations, and the potential for illiquid markets and political instability. Please see the end of this publication for more disclosures.
Important Disclosure Information:
The comments above refer generally to financial markets and not RiverFront portfolios or any related performance. Opinions expressed are current as of the date shown and are subject to change. Past performance is not indicative of future results and diversification does not ensure a profit or protect against loss. All investments carry some level of risk, including loss of principal. An investment cannot be made directly in an index.
The company identified above is an example of a holding and is subject to change without notice. The company has been selected to help illustrate the investment process described herein. A complete list of holdings is available upon request. This information should not be considered a recommendation to purchase or sell any particular security. It should not be assumed that any of the holdings listed have been or will be profitable, or that investment recommendations or decisions we make in the future will.
Information or data shown or used in this material was received from sources believed to be reliable, but accuracy is not guaranteed.
This report does not provide recipients with information or advice that is sufficient on which to base an investment decision. This report does not take into account the specific investment objectives, financial situation or need of any particular client and may not be suitable for all types of investors. Recipients should consider the contents of this report as a single factor in making an investment decision. Additional fundamental and other analyses would be required to make an investment decision about any individual security identified in this report.
Chartered Financial Analyst is a professional designation given by the CFA Institute (formerly AIMR) that measures the competence and integrity of financial analysts. Candidates are required to pass three levels of exams covering areas such as accounting, economics, ethics, money management and security analysis. Four years of investment/financial career experience are required before one can become a CFA charterholder. Enrollees in the program must hold a bachelor’s degree.
All charts shown for illustrative purposes only. Technical analysis is based on the study of historical price movements and past trend patterns. There are no assurances that movements or trends can or will be duplicated in the future.
Dividends are not guaranteed and are subject to change or elimination.
Stocks represent partial ownership of a corporation. If the corporation does well, its value increases, and investors share in the appreciation. However, if it goes bankrupt, or performs poorly, investors can lose their entire initial investment (i.e., the stock price can go to zero). Bonds represent a loan made by an investor to a corporation or government. As such, the investor gets a guaranteed interest rate for a specific period of time and expects to get their original investment back at the end of that time period, along with the interest earned. Investment risk is repayment of the principal (amount invested). In the event of a bankruptcy or other corporate disruption, bonds are senior to stocks. Investors should be aware of these differences prior to investing.
In general, the bond market is volatile, and fixed income securities carry interest rate risk. (As interest rates rise, bond prices usually fall, and vice versa). This effect is usually more pronounced for longer-term securities). Fixed income securities also carry inflation risk, liquidity risk, call risk and credit and default risks for both issuers and counterparties. Lower-quality fixed income securities involve greater risk of default or price changes due to potential changes in the credit quality of the issuer. Foreign investments involve greater risks than U.S. investments, and can decline significantly in response to adverse issuer, political, regulatory, market, and economic risks. Any fixed-income security sold or redeemed prior to maturity may be subject to loss.
Technology and internet-related stocks, especially of smaller, less-seasoned companies, tend to be more volatile than the overall market.
Index Definitions:
Standard & Poor’s (S&P) 500 Index measures the performance of 500 large cap stocks, which together represent about 80% of the total US equities market.
Definitions:
Earnings per share (EPS) is calculated as a company’s profit divided by the outstanding shares of its common stock. The resulting number serves as an indicator of a company’s profitability. It is common for a company to report EPS that is adjusted for extraordinary items and potential share dilution.
Mega cap is a designation for the largest companies in the investment universe as measured by market capitalization. While the exact thresholds change with market conditions, mega cap generally refers to companies with a market capitalization above $200 billion.
Artificial intelligence (AI) refers to the simulation of human intelligence by software-coded heuristics. Nowadays this code is prevalent in everything from cloud-based, enterprise applications to consumer apps and even embedded firmware.
The energy sector is a category of stocks that relate to producing or supplying energy. The energy sector or industry includes companies involved in the exploration and development of oil or gas reserves, oil and gas drilling, and refining. The energy industry also includes integrated power utility companies such as renewable energy and coal.
The technology sector is the category of stocks relating to the research, development, or distribution of technologically based goods and services. This sector contains businesses revolving around the manufacturing of electronics, creation of software, computers, or products and services relating to information technology.
RiverFront Investment Group, LLC (“RiverFront”), is a registered investment adviser with the Securities and Exchange Commission. Registration as an investment adviser does not imply any level of skill or expertise. Any discussion of specific securities is provided for informational purposes only and should not be deemed as investment advice or a recommendation to buy or sell any individual security mentioned. RiverFront is affiliated with Robert W. Baird & Co. Incorporated (“Baird”), member FINRA/SIPC, from its minority ownership interest in RiverFront. RiverFront is owned primarily by its employees through RiverFront Investment Holding Group, LLC, the holding company for RiverFront. Baird Financial Corporation (BFC) is a minority owner of RiverFront Investment Holding Group, LLC and therefore an indirect owner of RiverFront. BFC is the parent company of Robert W. Baird & Co. Incorporated, a registered broker/dealer and investment adviser.
To review other risks and more information about RiverFront, please visit the website at riverfrontig.com and the Form ADV, Part 2A. Copyright ©2023 RiverFront Investment Group. All Rights Reserved. ID 3107316
For more news, information, and analysis, visit the ETF Strategist Channel.