
One of the reasons we formed RBA in 2009 was we thought the US was entering one of the biggest bull markets of our careers. US corporate fundamentals, although poor on an absolute basis, were demonstrably improving, central banks were engineering an immense liquidity injection into the global economy, and investors were extraordinarily wary of US public equity. The makings of a major bull market seemed evident to us.
Investors were hesitant to invest with us given our bullishness, and due diligence meetings often centered on how defensive RBA’s strategies could become if there was another bear market. Protecting against a bear market was clearly more important to investors than was taking advantage of the opportunities.
Our marketing presentations accordingly mentioned “fire extinguishers” or strategies to be used “in case of emergency”. We weren’t employing such defensive strategies, but wanted to make it very clear to potential investors what RBA was likely to do if investment risk increased.
Today’s fundamentals are markedly different from those of ten years ago. Corporate fundamentals have been deteriorating all year, but remain healthy on an absolute basis. Global yield curves have begun to suggest that liquidity is starting to dry up. Investors are not necessarily euphoric regarding public equity but, as we’ve pointed out before, investment flows into private equity and venture capital have surpassed the Technology Bubble’s flows into US equity funds.
Investors seem to be following the historical precedent and are becoming increasingly bullish despite a deterioration in underlying fundamentals. With that in mind, it seems prudent to dust off the fire extinguishers.
Testing the fire extinguisher?
Real fire extinguishers get checked and tested regularly, but financial fire extinguishers often get rusty or ineffective because the financial markets change through time. Investors often assume their portfolios are diversified, however, asset classes that might provide significant portfolio diversification in one period might be quite ineffective in another. Investors tend to rely too much on marketing literature rather than unbiased statistical analyses to determine effective fire extinguishing asset classes.
Correlation among asset classes and not the number of asset classes ultimately determines the level of diversification within a portfolio.
Traditional portfolio construction includes numerous asset and sub-asset classes, but one could have a very well-diversified portfolio with only two assets if those two assets are very uncorrelated.
Correlations change through time as market and economic conditions change. Asset classes that could be very uncorrelated and provide significant diversification during one period might be highly correlated and provide no diversification in another.
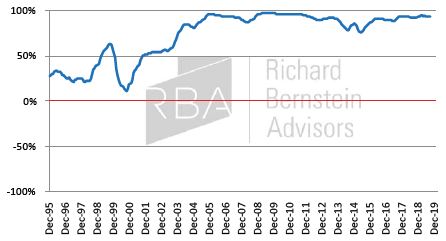
For example, many investors consider hedge funds and other alternatives to be asset classes that can significantly diversify a portfolio. Chart 1 shows the secular correlation between hedge funds and the S&P 500®. Hedge funds provided significant diversification to an equity portfolio during the chart’s earlier period (i.e., the correlation was low). However, the correlation today between hedge funds and equities is extremely high, which suggests investing in hedge funds provides limited, if any, diversification benefit. We regularly test our fire extinguishers for diversification efficacy because changes like those associated with hedge funds occur more frequently than many investors expect.
CHART 1:
Rolling 5-Year Correlation of Hedge Funds vs. S&P 500® (Dec. 1995 – Sep. 2019)
Ignoring the smoke alarm #1: analysts seem unaware of deteriorating profits
The current debate regarding the health of the US economy seems odd but is normal. It seems odd because the US is clearly in a late-cycle stage despite investors’ and the Fed’s denial (I.e., when have yield curves inverted other than late in a cycle?), but seems normal in that investors don’t believe the US is in a late-cycle. It is quite rare that investors anticipate deteriorating fundamentals, and this cycle seems to be fitting that norm.
Chart 2 shows that bottom-up earnings expectations (i.e., those derived by aggregating individual company forecasts) have NEVER forecasted a profits recession before one occurred, and current forecasts might be following that historical pattern.
CHART 2:
Consensus NTM EPS Growth Forecast vs. Actual Profits Cycle
(Apr. 1988—Sep. 2019)

Chart 3 (courtesy of Bloomberg based on a Morgan Stanley study) strongly suggests that analysts’ forecasts for large capitalization companies’ earnings may be too rosy. Estimates for small and mid- cap stocks have begun to fall, and that makes sense because smaller companies tend to be more sensitive to economic cycles. However, larger capitalization stocks’ earnings forecasts are still increasing!
The fact that bottom-up forecasts have never predicted a profits recession, that small and mid-cap earnings estimates are falling, and that large cap stocks’ estimates are rising seems to suggest more risk than investors are anticipating.
CHART 3:
Consensus Estimates: Large Caps vs. Mid and Small Caps (Dec. 2016 – Sep. 2019)

Source: Bloomberg Finance L.P. For Index descriptors, see “Index Descriptions” at end of document.
Ignoring the smoke alarm #2: “…but the consumer is fine…”
The September employment report was heralded by many as a healthy report because the unemployment rate hit a multi-decade low. While that is indeed good news, it is relatively worthless news for investors because the unemployment rate is a lagging indicator.
There are three categories of economic indicators: leading, coincident, and lagging. Leading indicators are those that tend to turn before GDP does, coincident indicators tend to turn in tandem with GDP, and lagging indicators tend to turn after GDP does. Because the equity market is itself a leading indicator, following coincident and lagging indicators can often hurt portfolio performance.
Chart 4 compares the unemployment rate (lagging indicator) with the Conference Board’s Employment Trends Indicator (a leading gauge of employment based on a combination of many economic indicators). So far the leading employment indicator looks considerably more pessimistic than the rosy lagging indicator that gets so much more attention.
CHART 4:
Leading vs Lagging Employment Indicators
(Sep. 1990 – Sep. 2019)

Source: Bloomberg Finance L.P.
Ignoring the smoke alarm #3: liquidity isn’t dry, but it’s drying up
Central banks were injecting huge amounts of liquidity into the global economy after the financial crisis, and the world’s yield curves steepened significantly. That steepness reflected the markets’ forecast that the central banks would be successful in preventing another recession.
Equity Investors, however, had little faith in the steep yield curves’ optimistic forecasts.
Today, global yield curves are extremely flat, but investors regularly state that the world is “awash in liquidity”. Earlier in the decade investors ignored the curves’ optimistic forecast and today they are ignoring the curves’ pessimistic forecast. Like the stock analysts who have yet to forecast a profits recession, portfolio managers are largely ignoring deteriorating liquidity. Despite the yield curve’s forecasting successes, the recent BofAML’s Global Fund Manager Survey1 shows that only 25% of fund managers surveyed believe that the US’s inverted yield curve portends a recession within the next 12 months (see Chart 5).
CHART 5:
Yield Curve Inversion Question from BofAML’s Global Fund Manager Survey
(Sep. 2019)

Taking the fire extinguishers off the wall
Whereas consensus is that the bull market is firmly intact, we have been toning down the risk within our strategies. The following charts show some of the repositioning that has gone on within RBA’s strategies during 2019.
1. Defensives vs. cyclicals
Chart 6 shows that our long-standing preference for cyclicals began to decrease during late-2018 and completely reversed in 2019. The positions shown are for our flagship Global Risk Balanced Moderate ETF Strategy.
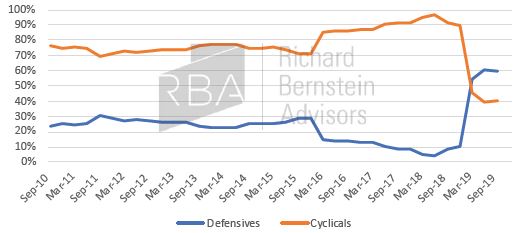
Source: Richard Bernstein Advisors, Bloomberg Finance L.P. Defensives = Consumer Staples, HealthCare, Utilities, Real Estate post 9/30/16 GICS reclassification, Telecomm Svcs. pre 9/30/18 GICS reclassification. Cyclicals = Consumer Discretionary, Energy, Financials, Industrials, Materials, Information Technology, Communication Svcs. post 9/30/18 GICS reclassification.
2. Equity sensitivity decreased
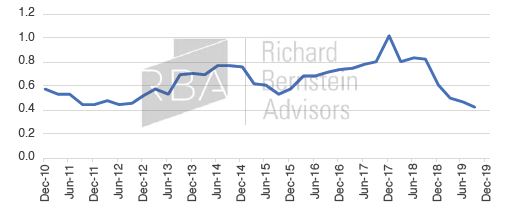
Chart 7 shows the equity beta of the strategy through time. As we’ve pointed out many times (http://www.rbadvisors.com/images/pdfs/Asset_ Allocation_2.0.pdf), RBA categorizes assets not by the tradition name, but rather by their correlation to major asset categories. Thus, our equity beta shown incorporates the equity sensitivity across all asset classes. Currently, the equity beta is the lowest in the history of the strategy.
CHART 7:
RBA Global Risk-Balanced Moderate ETF Strategy: Beta to MSCI ACWI®
(Dec. 2010 – Sep. 2019)
3. Volatility sensitivity increased
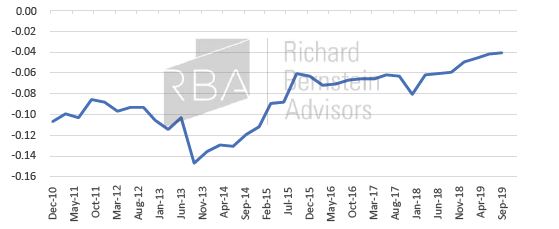
Chart 8 shows the beta to implied volatility, and it is the highest in the history of the strategy. This means that the strategy is positioned to benefit from higher volatility. We highlighted last month (http:// www.rbadvisors.com/images/pdfs/RBA_Insights_Sept2019.pdf) that history suggests the decrease in global liquidity could lead to a multi- year period of higher volatility. That does not necessarily imply that expected returns are too high, but it does imply that investors are probably underestimating the volatility or overestimating the certainty accompanying expected returns.
CHART 8:
RBA Global Risk-Balanced Moderate ETF Strategy: Beta to CBOE Volatility (VIX)
(Dec. 2010 – Sep. 2019)
Source: Richard Bernstein Advisors, Bloomberg Finance L.P., Axioma
Doing exactly what we promised…just not when investors thought it would happen.
When RBA first mentioned at the beginning of the decade our ability to utilize “fire extinguishers,” investors generally thought we’d be using them soon because they didn’t anticipate a major bull market. Today,
in the latter stages of the economic and market cycles, relatively few investors ask us about potential defensive tactics.
However, the positioning we are employing today is exactly what we suggested we’d do when we thought the appropriate time came. Our strategies are more defensively positioned, we have lowered the equity beta of the strategies, and increased exposure to assets that typically perform in periods of elevated volatility.
We’re starting to smell smoke, and the fire extinguishers are off the wall.
Richard Bernstein Advisors is a participant in the ETF Strategist Channel.
To learn more about RBA’s disciplined approach to macro investing, please contact your local RBA representative. www.rbadvisors.com/images/pdfs/Portfolio_Specialist_Map.pdf
Don’t miss out on future RBA Insights, Subscribe today: jump.rbadvisors.com/subscribe.
