
By Nyle Bayer, Helios Quantitative Research
The secret is out; the S&P 500 has had a terrific year of performance. With today the final trading day left in the year (or decade depending on who you ask), 2019 is on the heels of being the best performing year in for the index since 1997, when the return was 31%.
For context, the movie Titanic was released in 1997, and the number 1 selling album was Spice Girls. However thankful you are that you don’t have to hear another song from Spice Girls or watch Jack get the boot in the final scenes of Titanic, I am sure you don’t mind reliving the returns from that year.
Who cares about last year? We work in a thankless business where investors are always looking forward when it comes to compounding their returns, and with the markets scraping new highs, it’s only natural to wonder if 2020 has the potential to become another 2018.
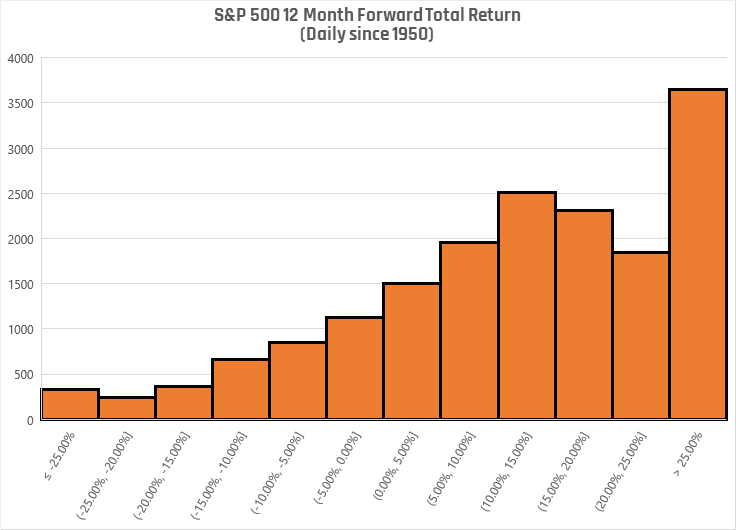
Let’s take a look at some data that Joe Mallen, our CIO, was kind enough to pull for us (data via Bloomberg). Below you will find a bar chart that shows the total return of the S&P 500 twelve months after each trading day’s close. As you can see, the market is positive most of the time. To be precise, the market is up 79.35% of the time. Not bad.
Now let’s look at where we are today, an all-time high. What we see here is that one year after the market closes a trading day at an all-time high, the return is positive 79.70% of the time. Not a huge difference, but still slightly better.
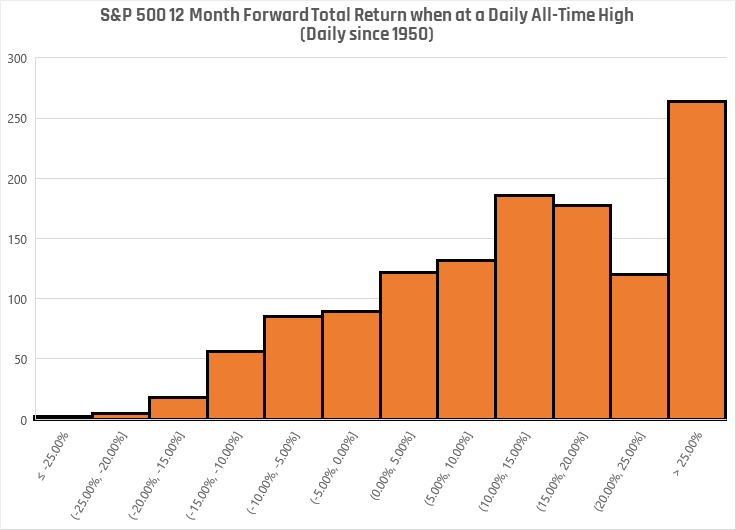
I apologize if these results seem underwhelming because at first, I thought they were as well. However, when you think about it, what this means is that all-time highs are neither an indicator of the market being at the top nor does it indicate that it is due for a decline. If anyone is making you nervous or optimistic about the sole data point of all-time highs, the charts above should provide you confirmation that their information is noise and can be discarded.
As a Financial Advisor, now is a superb time to take a sentiment check on your clients. How were they feeling this time last year when the market was in decline vs. this year when the market is reaching new heights? Has their risk tolerance changed, and if so, is it because of the market?
Having a rules-based investment strategy in place which targets a specific range of volatility rather than simple modern portfolio theory can be a helpful tool to fight against behavioral flaws that markets can bring us.
If you need help with that, let us know. It’s our specialty!
Nyle Bayer, follow me on Twitter @nylebayer.
This article was written by Nyle Bayer of Helios Quantitative Research, a participant in the ETF Strategist Channel.
Helios Quantitative Research provides financial advisors with the ability to offer state-of-the art, algorithm-driven asset management solutions to their clients on any platform. This allows advisors to:
Provide clients a better asset management experience
Reduce client fees by up to 30%
Drive higher revenues by up to 50%
For more information, visit www.HeliosDriven.com.
